Fig. 3
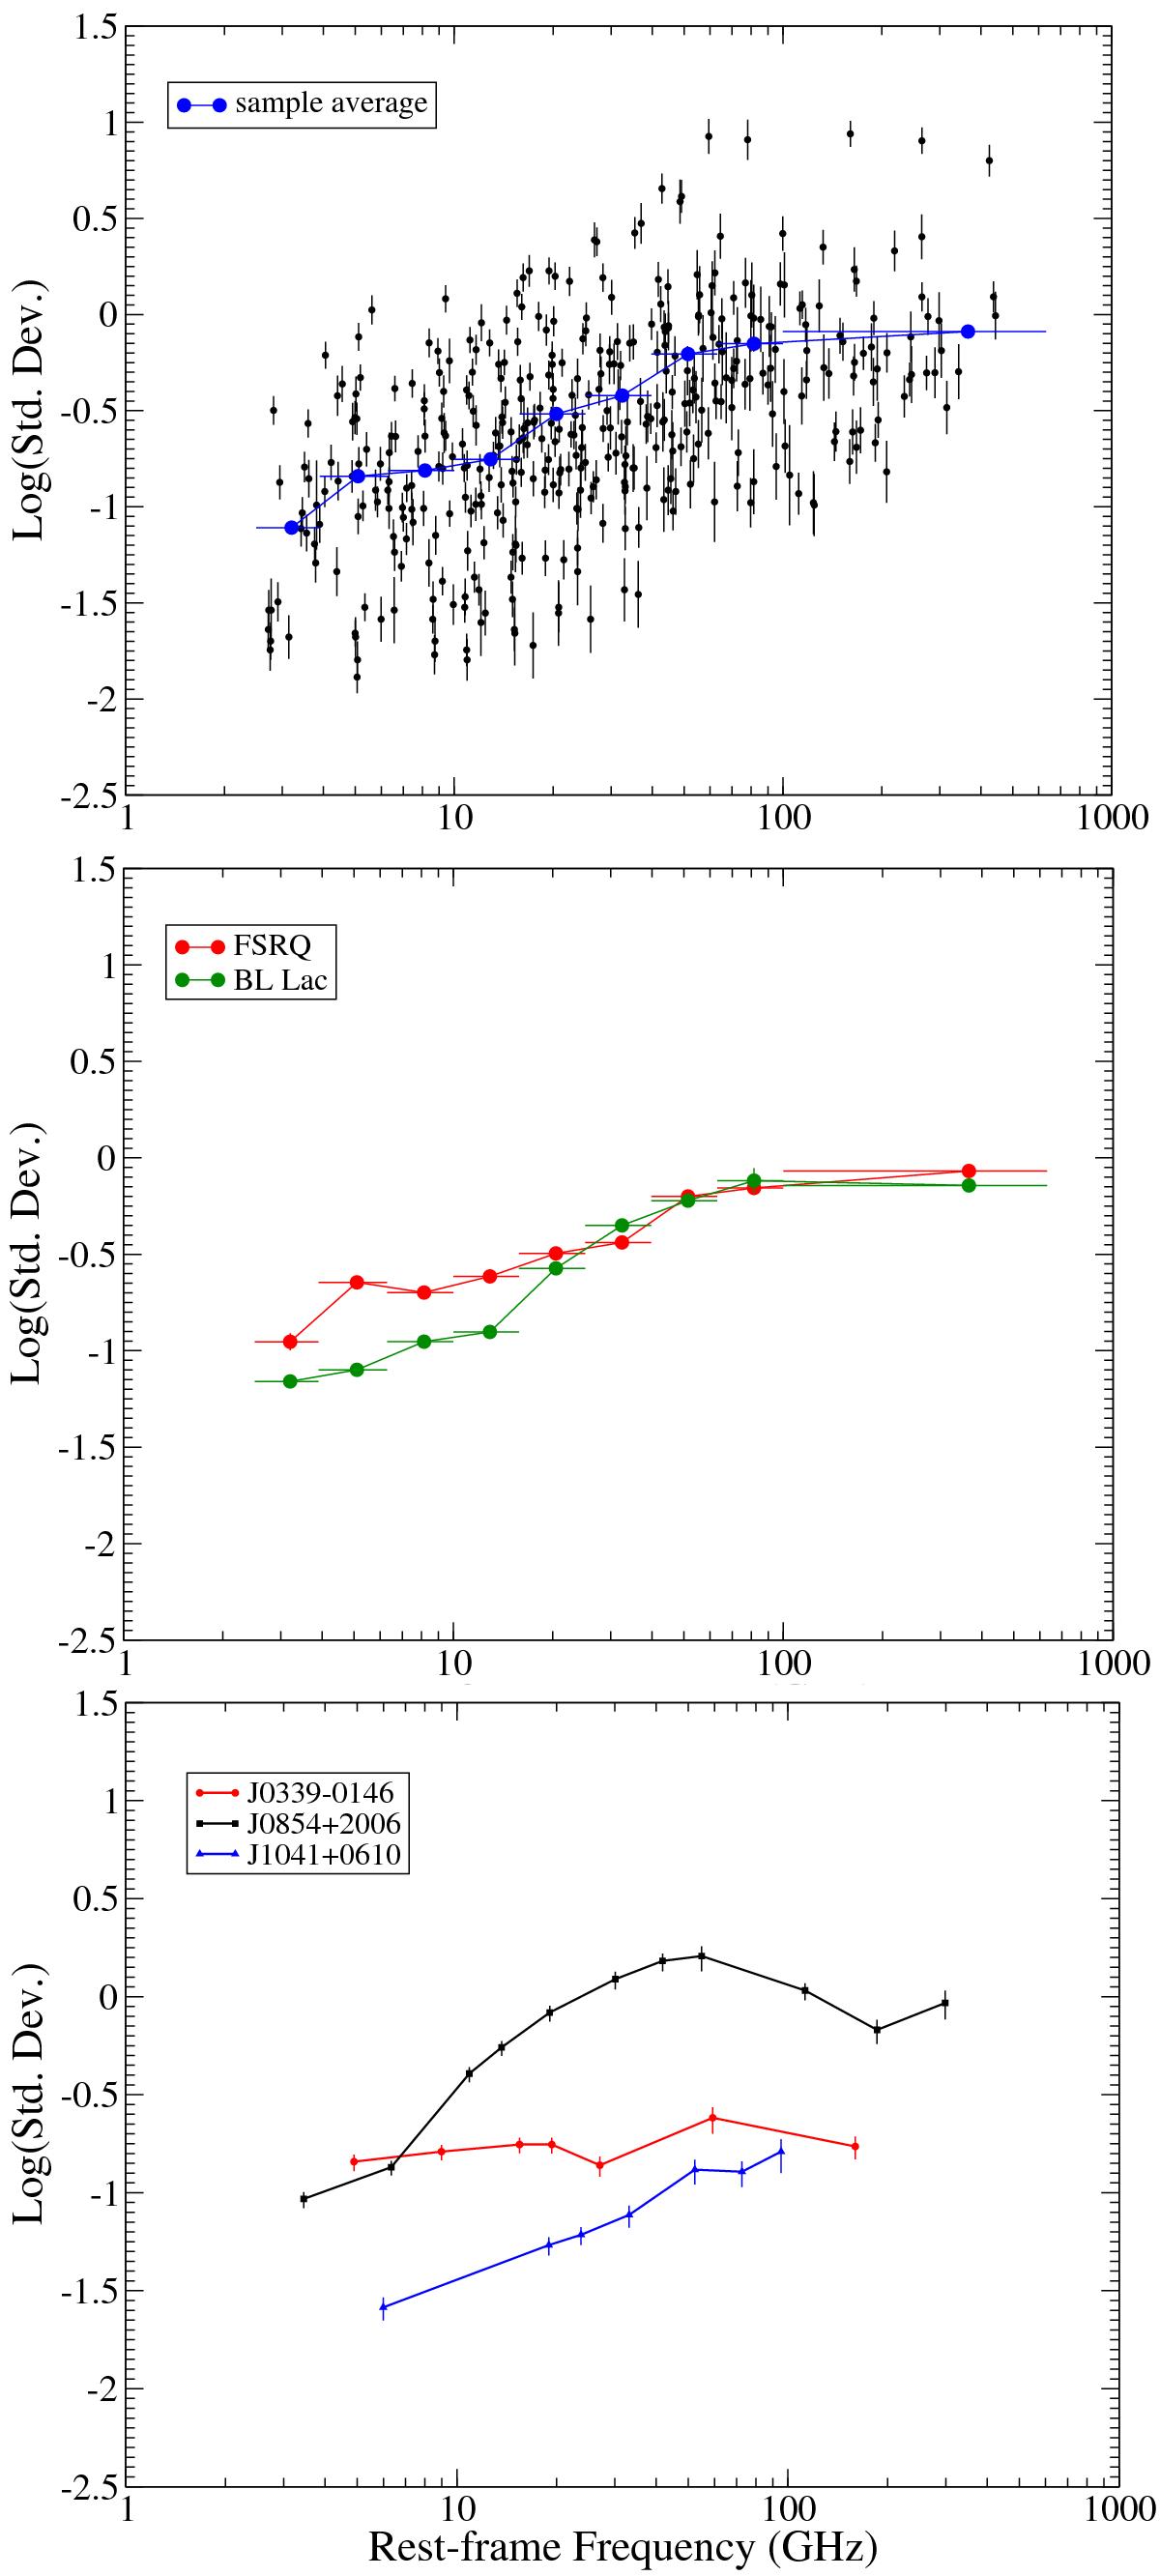
Strength of variability (flux standard deviation) with respect to rest-frame frequency as observed with EB and PV. Top: Scatter plot (black, all sources) showing increasing variations with frequency. Superimposed are shown the logarithmic sample averages of the standard deviation after binning in frequency space. Middle: logarithmic averages of the standard deviation obtained for the FSRQs (red) and BL Lacs (green) in the sample. Bottom: three examples of individual sources showing (i) a rising trend (blue); (ii) a clear peak (black); and (iii) a nearly flat trend of variability amplitude across our bandpass (red).
Current usage metrics show cumulative count of Article Views (full-text article views including HTML views, PDF and ePub downloads, according to the available data) and Abstracts Views on Vision4Press platform.
Data correspond to usage on the plateform after 2015. The current usage metrics is available 48-96 hours after online publication and is updated daily on week days.
Initial download of the metrics may take a while.