Fig. 9
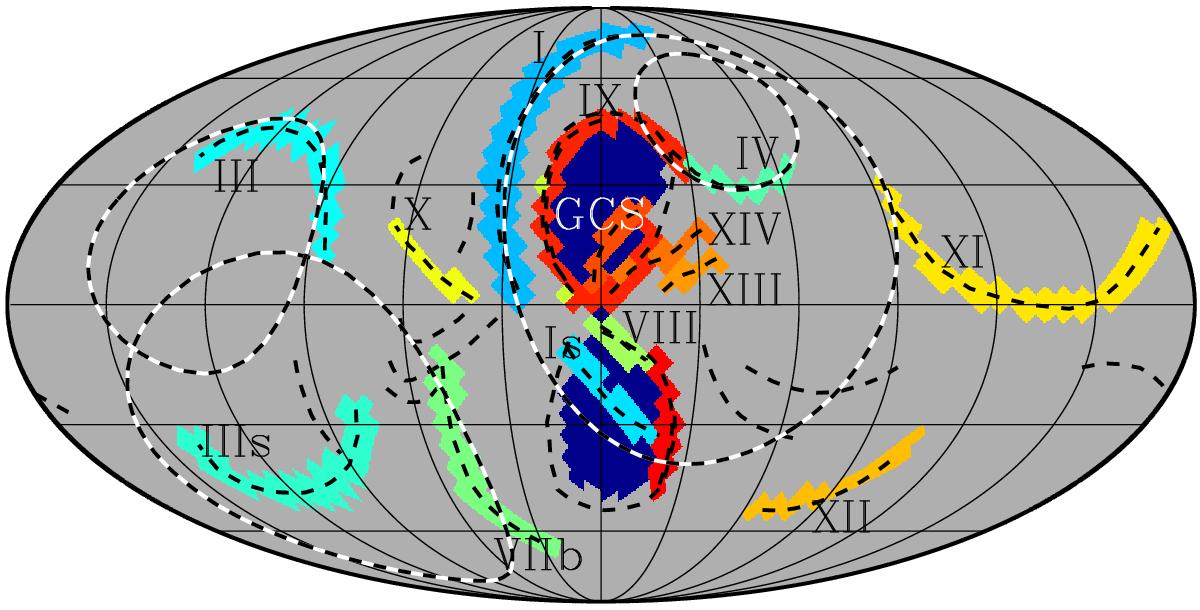
The regions masked for each of the loops and spurs defined by Planck Collaboration XXV (2016) and Vidal et al. (2015) as well as for the region on the edge of (red) or inside of (dark blue) the Fermi bubbles. The dashed lines delineate the emission ridges (black) and the four largest radio loops at their original locations (black and white).
Current usage metrics show cumulative count of Article Views (full-text article views including HTML views, PDF and ePub downloads, according to the available data) and Abstracts Views on Vision4Press platform.
Data correspond to usage on the plateform after 2015. The current usage metrics is available 48-96 hours after online publication and is updated daily on week days.
Initial download of the metrics may take a while.