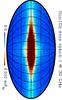
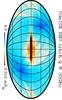
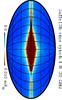
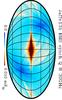
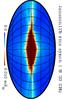
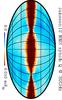
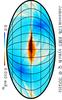
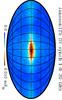
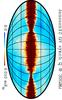
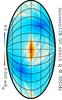
Fig. 7
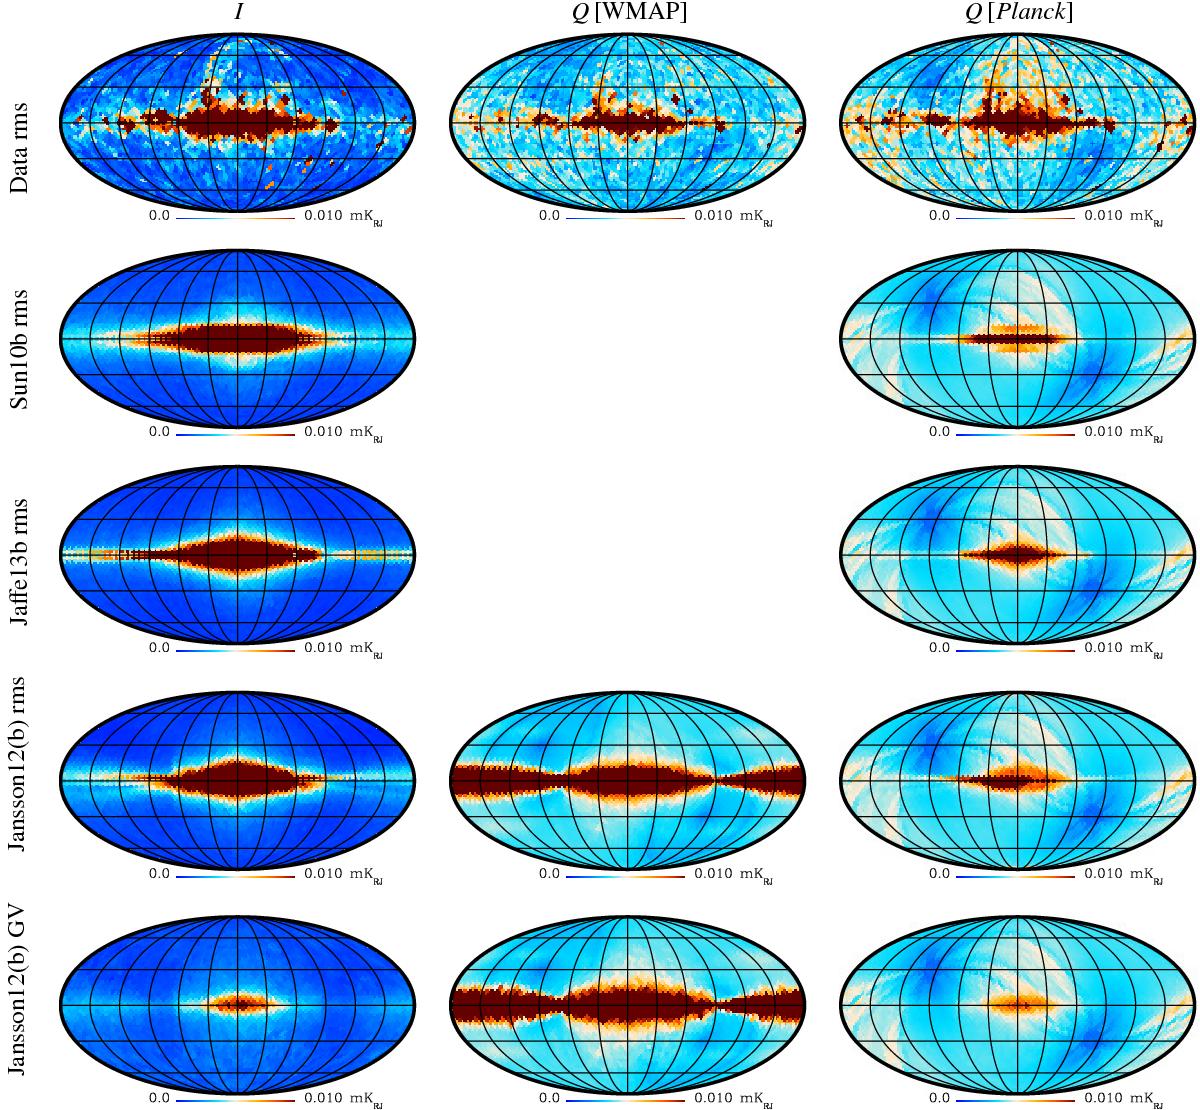
Comparison of estimates for galactic variance in data and models. The top row shows estimates from the data, while the following rows show the model predictions. Excepting the last row, these estimates are based on the rms variations in each low-resolution (Nside = 16) pixel. From left to right, the top row shows the estimates from the synchrotron total intensity from Commander, the synchrotron Q map from WMAP MCMC (extrapolated to 30 GHz), and the synchrotron Q map from Commander. (The Stokes U maps, not shown, look very similar to those for Q.) The updated Sun10b model is on the second row, the updated Jaffe13b model on the third row, and two versions of the Jansson12 model are in each of the fourth and bottom rows. To each model prediction of the ensemble variance is added simulated noise. In the case of Sun10b and Jaffe13b, we only show the updated model but for Jansson12, we compare the original model (middle column) optimized with WMAP MCMC I and Q and the updated Jansson12b model (left and right) optimized with the Commander synchrotron solution. For comparison, the last row shows the full galactic variance in each pixel for the Jansson12 models, as described in the text.
Current usage metrics show cumulative count of Article Views (full-text article views including HTML views, PDF and ePub downloads, according to the available data) and Abstracts Views on Vision4Press platform.
Data correspond to usage on the plateform after 2015. The current usage metrics is available 48-96 hours after online publication and is updated daily on week days.
Initial download of the metrics may take a while.