Free Access
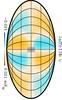
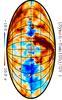
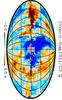
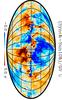
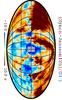
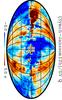
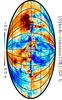
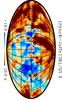
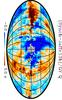
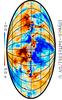
Fig. 6
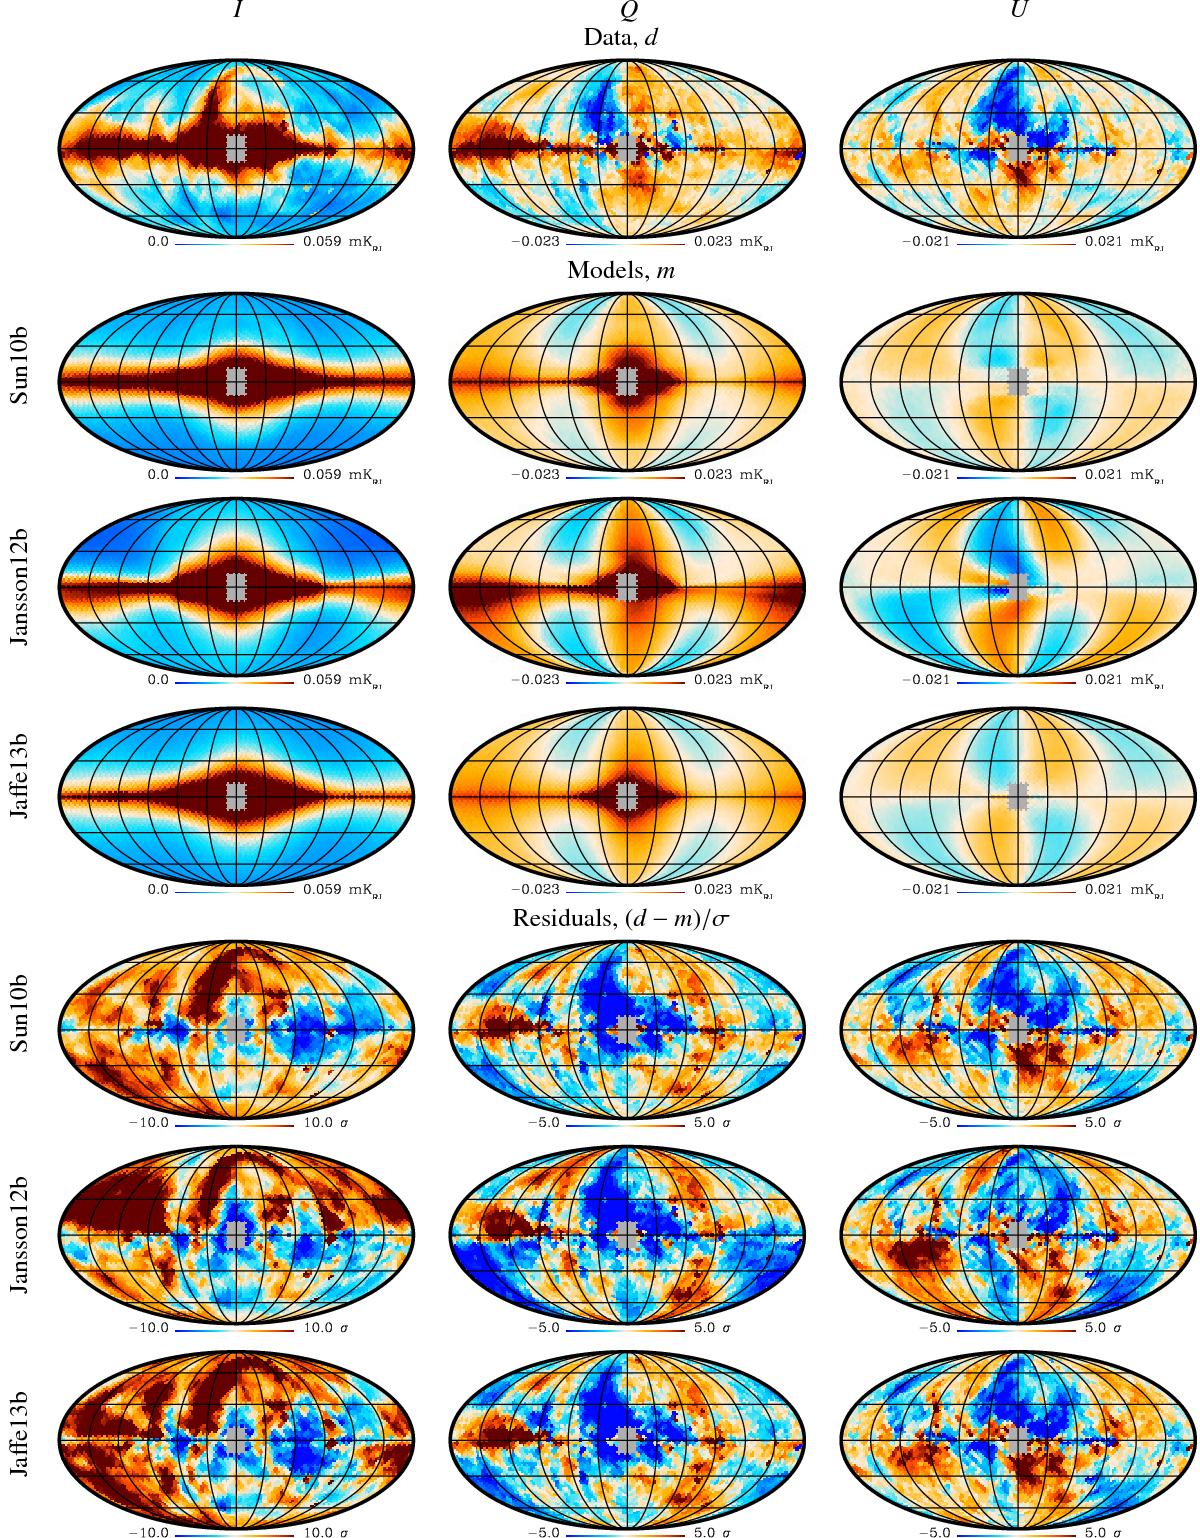
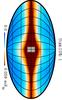
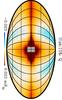
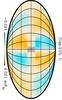
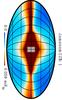
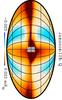
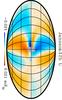
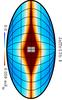
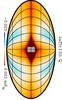
Comparison of the model predictions for synchrotron emission and the Planck synchrotron maps. The columns from left to right are for Stokes I, Q, and U, while the rows are the data followed by the prediction for each model, and lastly the difference between model and data divided by model uncertainty (galactic variance).
This figure is made of several images, please see below:
Current usage metrics show cumulative count of Article Views (full-text article views including HTML views, PDF and ePub downloads, according to the available data) and Abstracts Views on Vision4Press platform.
Data correspond to usage on the plateform after 2015. The current usage metrics is available 48-96 hours after online publication and is updated daily on week days.
Initial download of the metrics may take a while.