Fig. 4
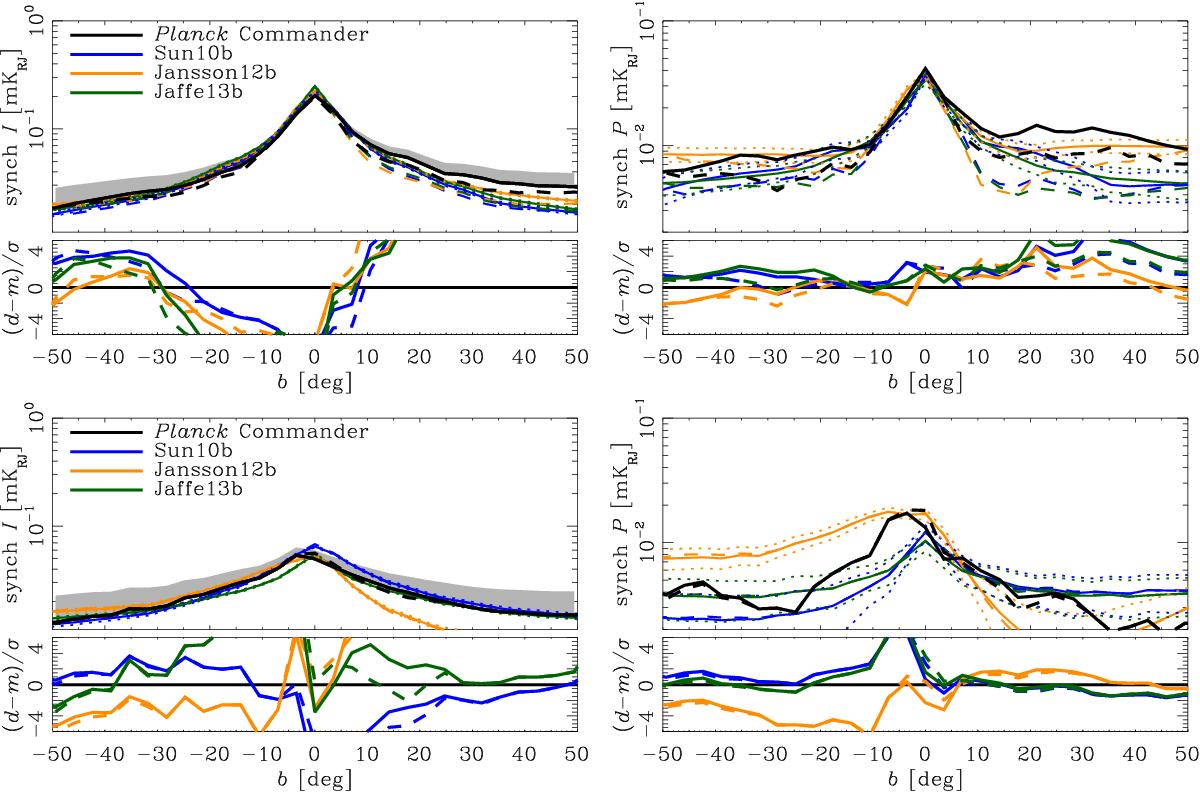
Synchrotron latitude profiles for the data and the updated models’ ensemble average. The observables are averaged over a range of longitudes for a given latitude bin, and on the left is total intensity and on the right polarized intensity. The top shows the inner Galaxy (i.e., −90° <l< 90°), while the bottom shows the third quadrant (180° <l< 270°, i.e., the outer Galaxy excluding the Fan region). The dotted coloured lines show the model mean plus or minus the expected variation predicted by the models (though these are often too close to the solid lines to be visible). This variation is also the σ used to compute the significance of the residuals in the bottom panel of each row. The dashed curves show the profiles excluding the loops and spurs discussed in Sect. 3.4.3. The grey band shows the ± 3 K zero-level uncertainty of the data at 408 MHz extrapolated with β = −3.1.
Current usage metrics show cumulative count of Article Views (full-text article views including HTML views, PDF and ePub downloads, according to the available data) and Abstracts Views on Vision4Press platform.
Data correspond to usage on the plateform after 2015. The current usage metrics is available 48-96 hours after online publication and is updated daily on week days.
Initial download of the metrics may take a while.