Fig. 3
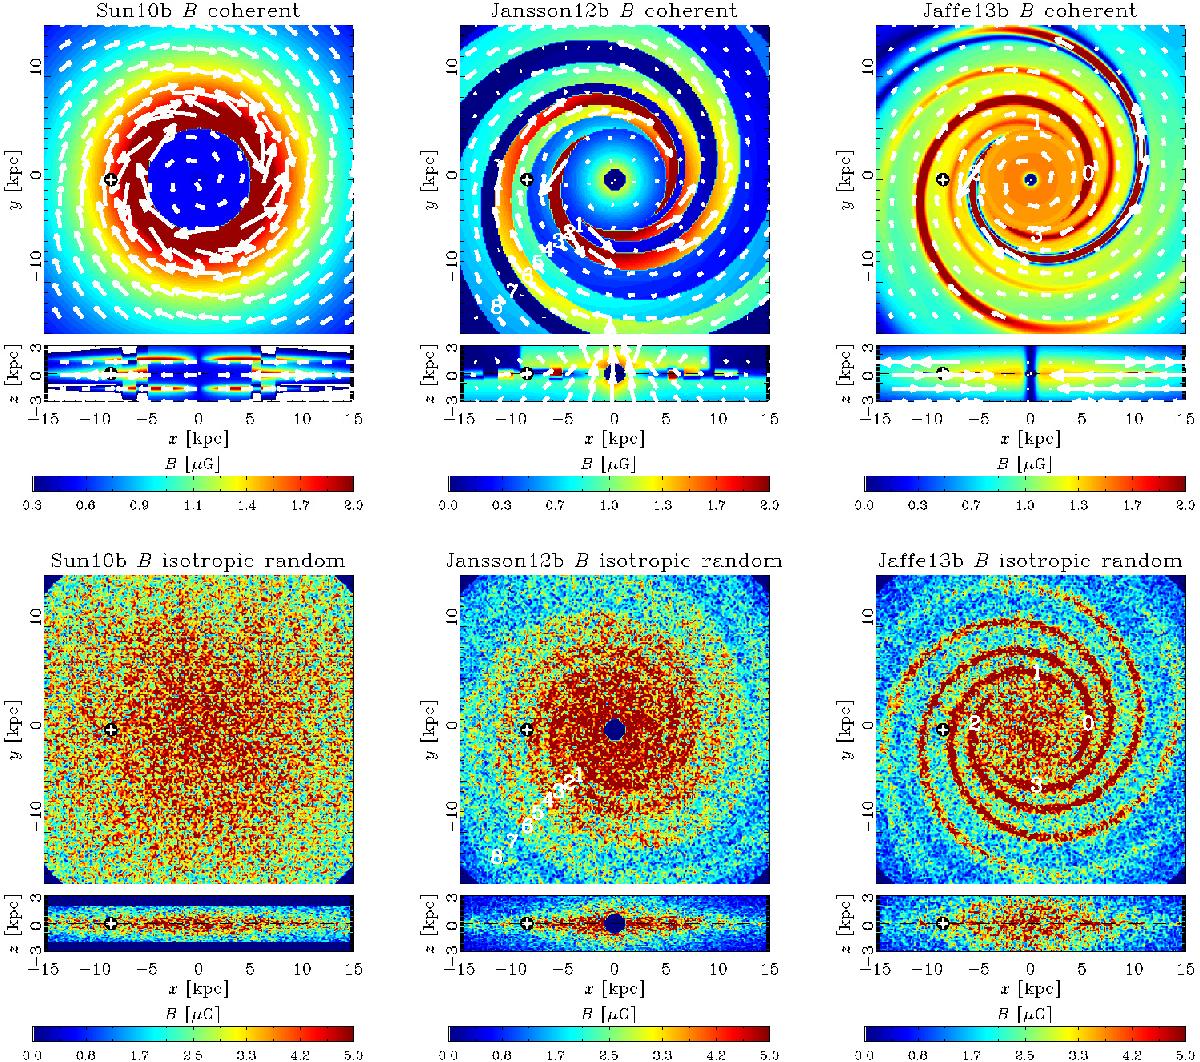
Comparison of the updated magnetic field models described in Sect. 3.3. Each column shows one of the models. The top row shows both the coherent field amplitude in colour (on a common scale) and the projected direction shown by the arrows. The top portion of each panel shows the x-y plane at z = 0, while the bottom portion shows the x-z plane at y = 0. The bottom row shows the amplitude of a single realization of the isotropic random field component. The white cross in a black circle shows the position of the observer.
Current usage metrics show cumulative count of Article Views (full-text article views including HTML views, PDF and ePub downloads, according to the available data) and Abstracts Views on Vision4Press platform.
Data correspond to usage on the plateform after 2015. The current usage metrics is available 48-96 hours after online publication and is updated daily on week days.
Initial download of the metrics may take a while.