Fig. 2
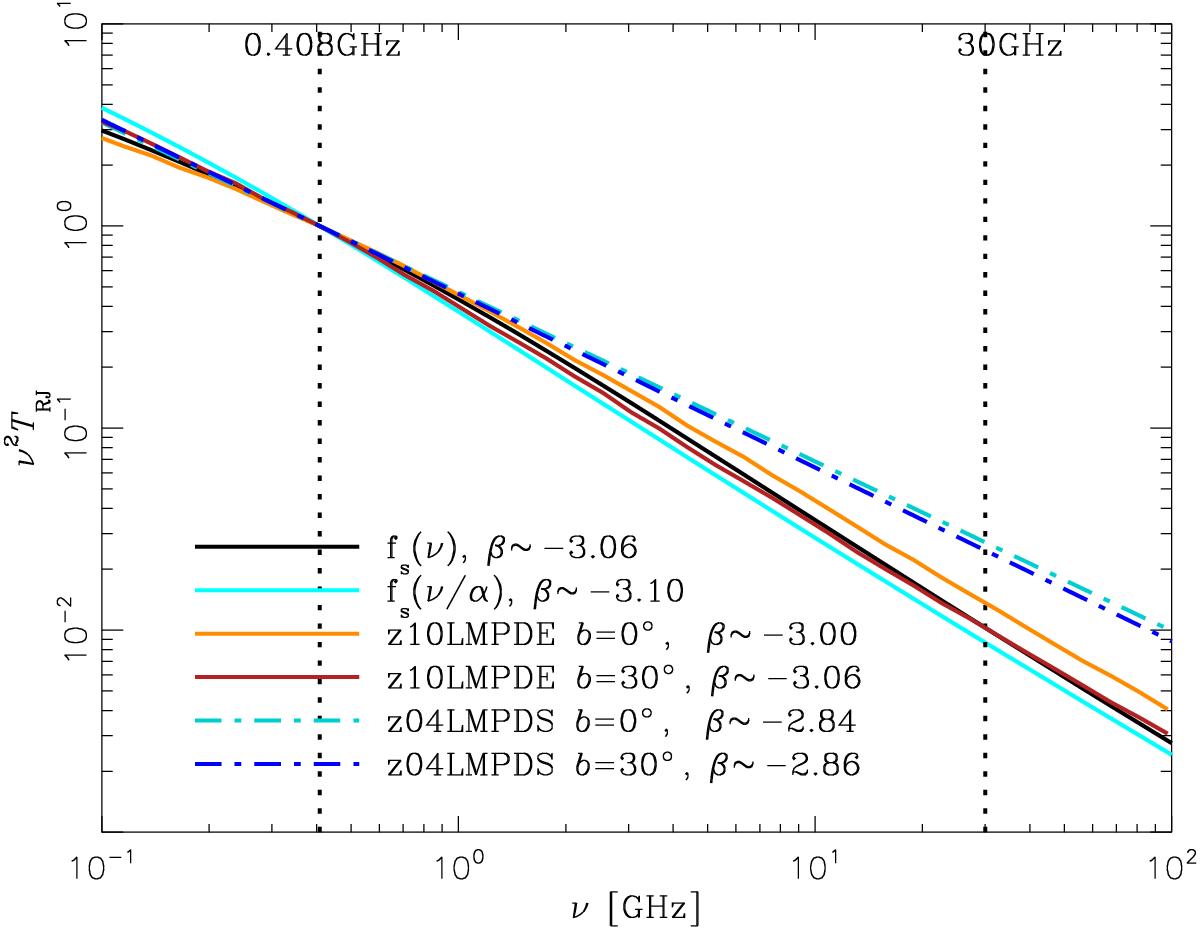
Comparison of synchrotron spectra for different CRL models, all normalized to one at 408 MHz. The black solid curve shows the original spectral template used in the Commander analysis, while the cyan solid curve shows the shifted template as described in Planck Collaboration X (2016). In orange is the resulting SED on the plane for synchrotron emission computed using the z10LMPDE CRL model on which the Commander template is based. This curve shows the average curve for the Galactic plane, while the brick red is the average for the pixels on a ring at b = 30°. For these spectra, the effective spectral index ![]() is computed. Lastly, the light and dark blue dot-dashed lines show the power law with the effective indices for the z04LMPDS model averaged at the two latitudes.
is computed. Lastly, the light and dark blue dot-dashed lines show the power law with the effective indices for the z04LMPDS model averaged at the two latitudes.
Current usage metrics show cumulative count of Article Views (full-text article views including HTML views, PDF and ePub downloads, according to the available data) and Abstracts Views on Vision4Press platform.
Data correspond to usage on the plateform after 2015. The current usage metrics is available 48-96 hours after online publication and is updated daily on week days.
Initial download of the metrics may take a while.