Fig. B.1
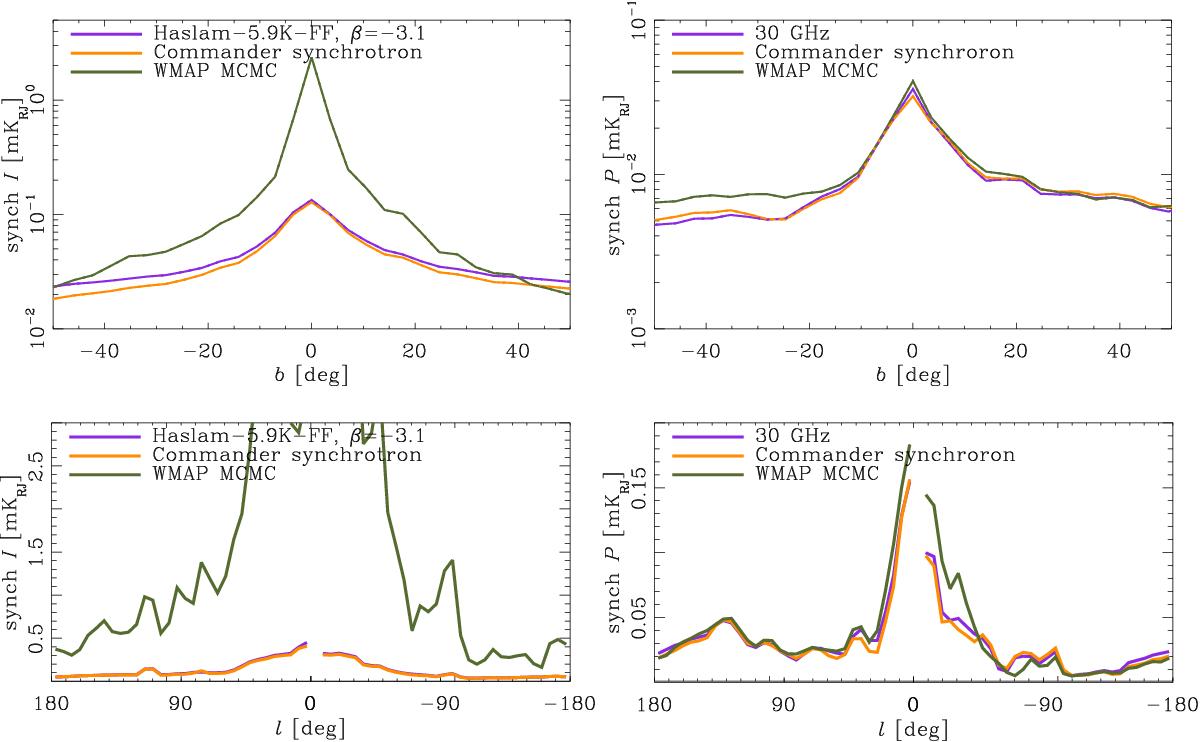
Comparison of synchrotron data sets as latitude (top) and longitude (bottom) profiles.For the latitude profiles, the full sky is averaged excluding the inner 10° (|b| < 10° and | l | < 10°). For the longitude profiles, only the pixels along the plane are plotted. In total intensity on the left, the Commander synchrotron solution, which is identical (except for an offset) to the Haslam 408 MHz map, is compared to the WMAP MCMC synchrotron solution. In polarization, on the right, the Commander synchrotron is compared to the LFI 30 GHz map itself and the WMAP MCMC synchrotron solution extrapolated to 30 GHz assuming β = −3.
Current usage metrics show cumulative count of Article Views (full-text article views including HTML views, PDF and ePub downloads, according to the available data) and Abstracts Views on Vision4Press platform.
Data correspond to usage on the plateform after 2015. The current usage metrics is available 48-96 hours after online publication and is updated daily on week days.
Initial download of the metrics may take a while.