Fig. A.1
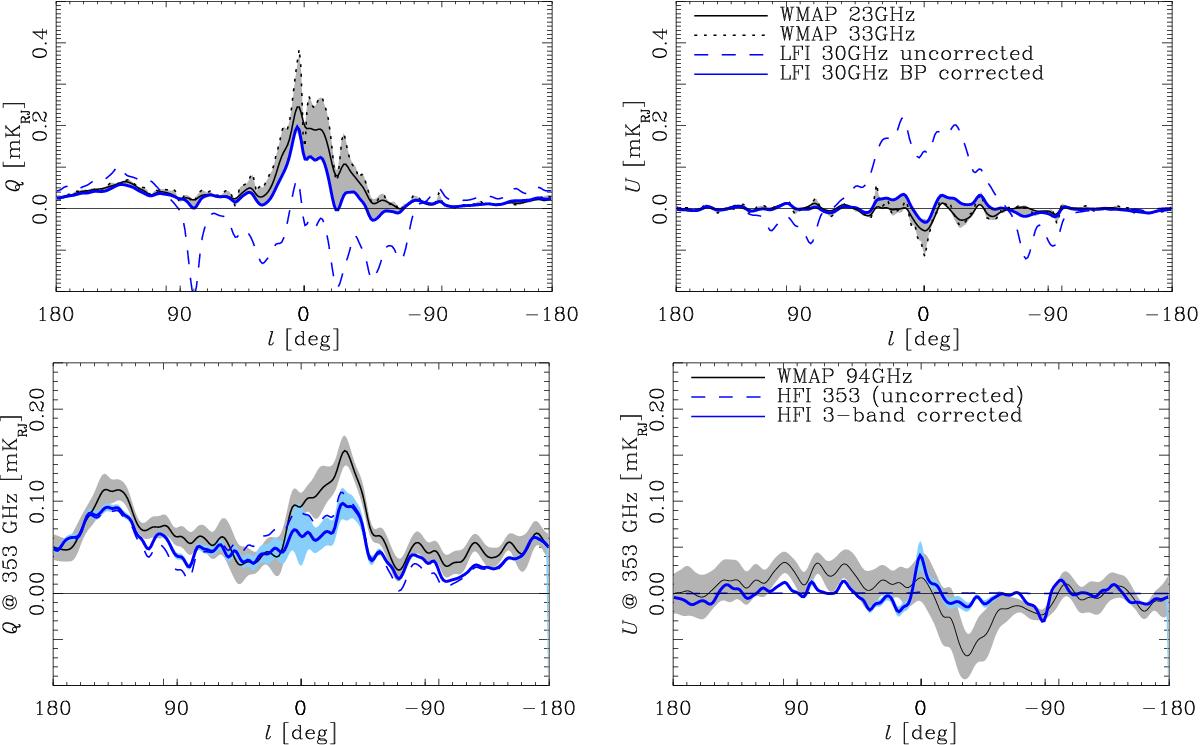
Top: comparison of LFI 30 GHz Stokes Q (left) and U (right) with WMAP 23 and 33 GHz along the Galactic plane smoothed to a full width half maximum (FWHM) of 6°. All frequencies are over-plotted by extrapolating the WMAP data to 30 GHz using a synchrotron β = −2.95 (Jaffe et al. 2011). The grey band shows the rms variation among them.Bottom: average profile of three HFI frequencies with ground-based bandpass leakage correction. The 143 and 217 GHz frequencies are extrapolated to 353 GHz using the Planck dust model spectrum of Planck Collaboration XI (2014). The dark blue curve shows the average of the frequencies with a pale blue band showing the variance.The WMAP 94 GHz data are also extrapolated to 353 GHz in order to compare its profile in solid black with the grey band showing its variation among different years.
Current usage metrics show cumulative count of Article Views (full-text article views including HTML views, PDF and ePub downloads, according to the available data) and Abstracts Views on Vision4Press platform.
Data correspond to usage on the plateform after 2015. The current usage metrics is available 48-96 hours after online publication and is updated daily on week days.
Initial download of the metrics may take a while.