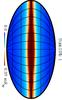
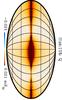
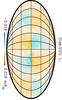
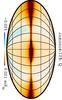
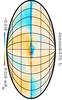
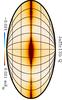
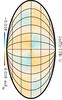
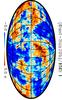
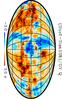
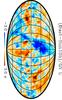
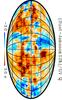
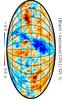
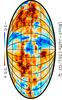
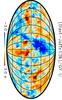
Fig. 13
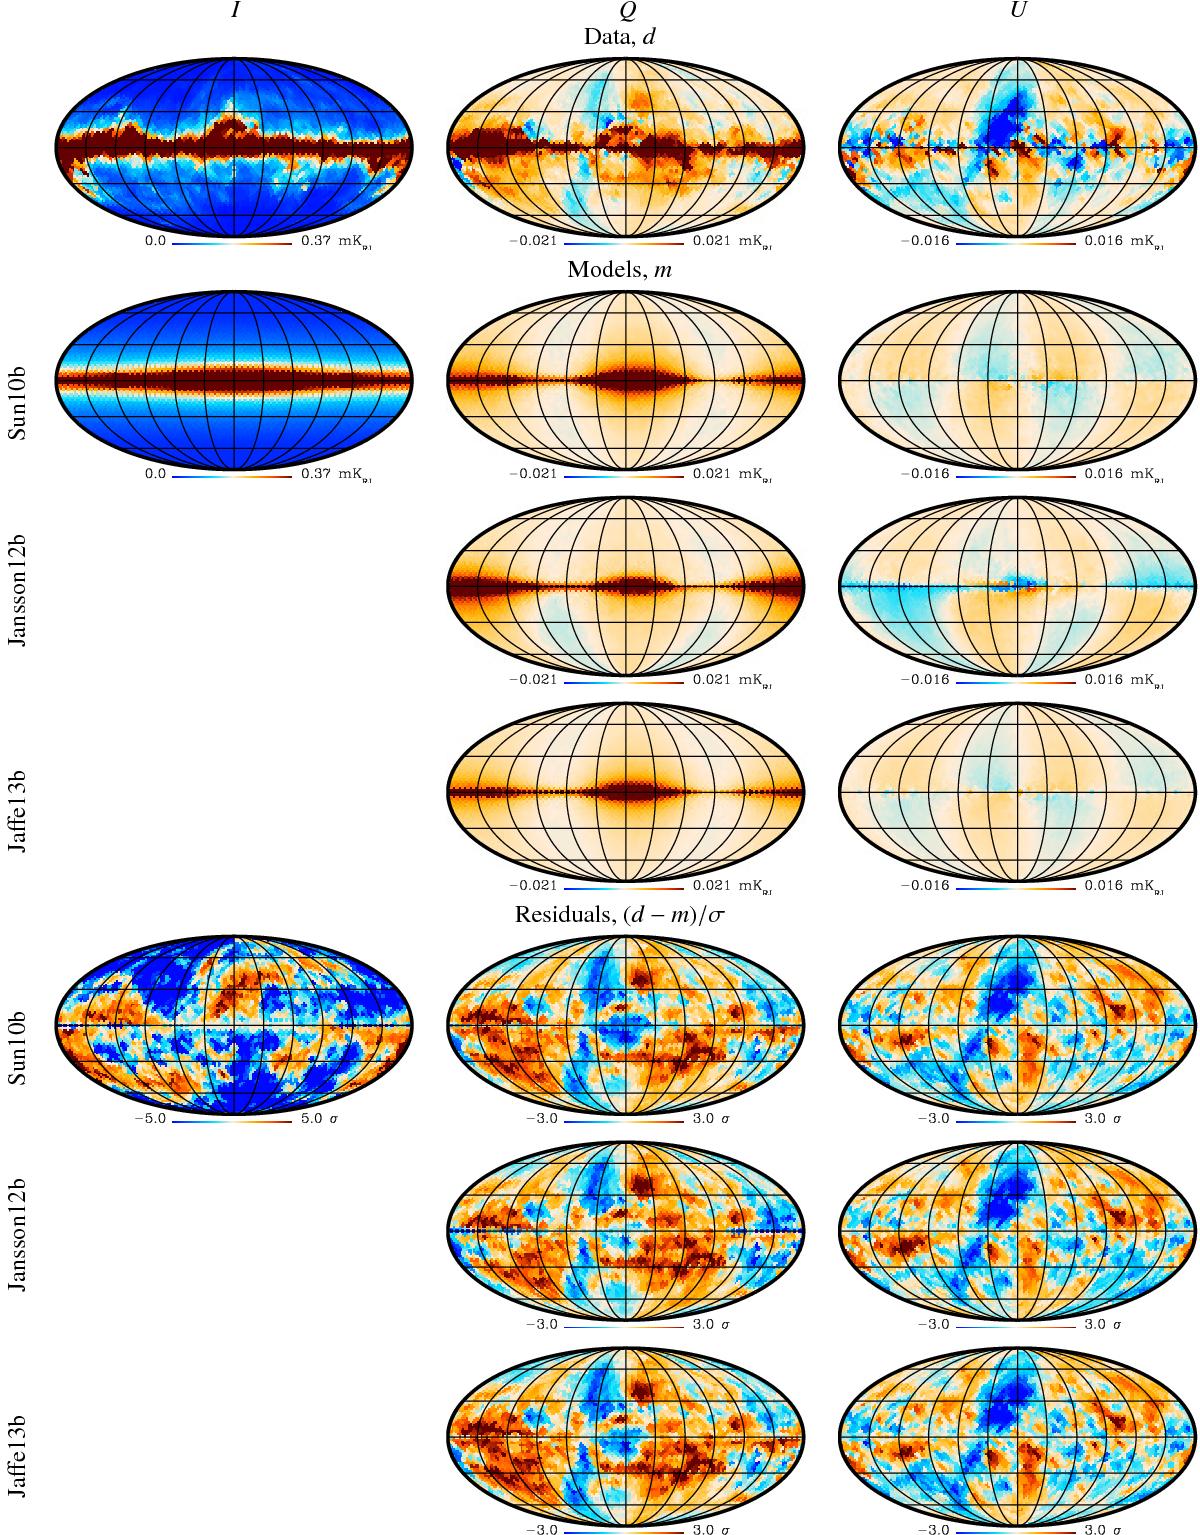
Comparison of the model predictions for dust and the Planck data. The columns from left to right are for Stokes I, Q, and U, while the rows are the data followed by the prediction for each model, and lastly the difference between model and data divided by the uncertainty.As for synchrotron emission, the polarization uncertainty is computed as the ensemble variance predicted by the models. Since dust total intensity is not a function of the magnetic field, its uncertainties are computed from the sky rms of the dust map.
Current usage metrics show cumulative count of Article Views (full-text article views including HTML views, PDF and ePub downloads, according to the available data) and Abstracts Views on Vision4Press platform.
Data correspond to usage on the plateform after 2015. The current usage metrics is available 48-96 hours after online publication and is updated daily on week days.
Initial download of the metrics may take a while.