Free Access
Fig. 10
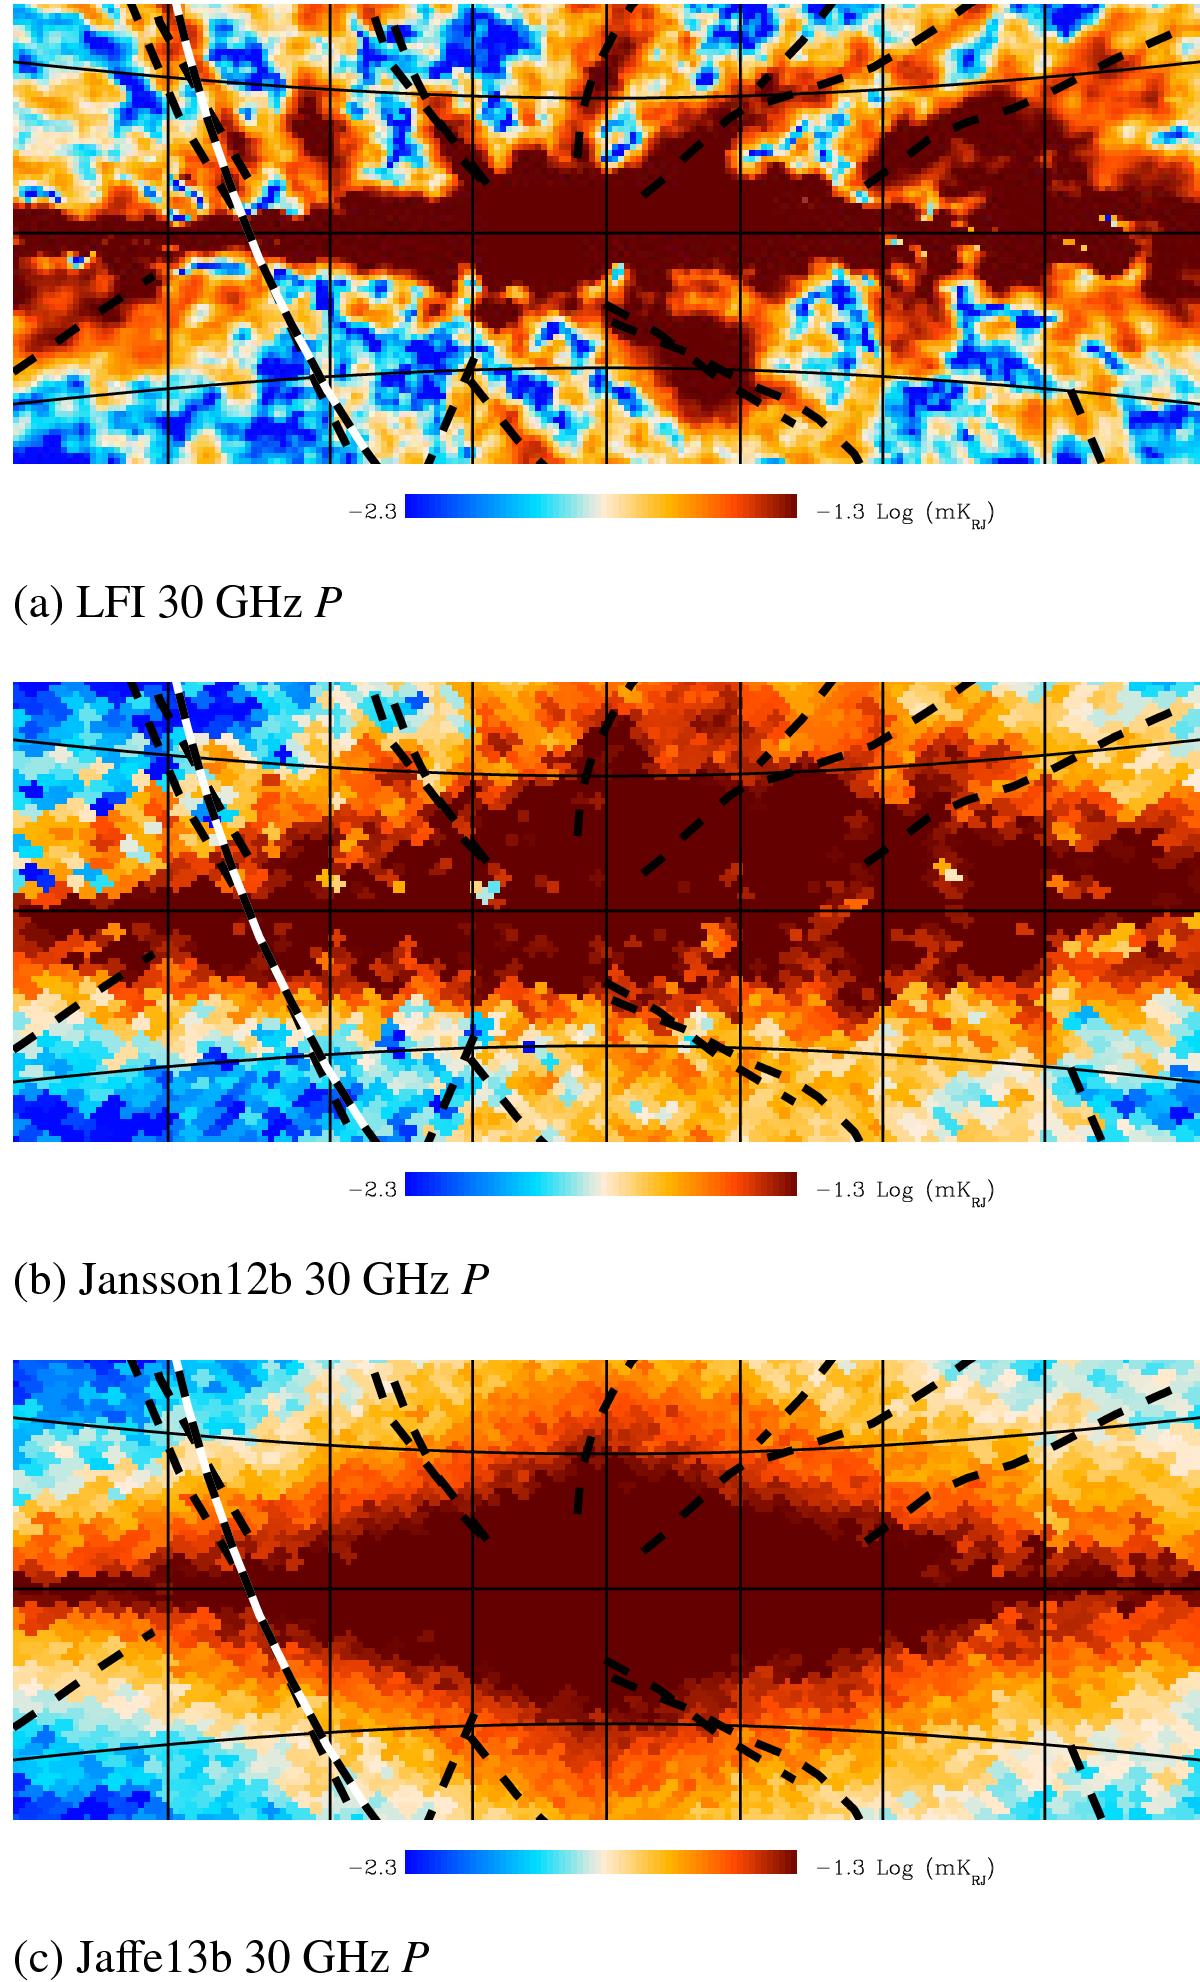
Zooms centred on the inner Galactic region (in a Gnomonic projection with a 10° grid) for the P of the data (top) and two of the models (one realization of each). The dashed lines are the spurs and loops as in Fig. 9. (Recall that in the profile plots, the region where | l | < 10° and | b | < 10° is masked.)
This figure is made of several images, please see below:
Current usage metrics show cumulative count of Article Views (full-text article views including HTML views, PDF and ePub downloads, according to the available data) and Abstracts Views on Vision4Press platform.
Data correspond to usage on the plateform after 2015. The current usage metrics is available 48-96 hours after online publication and is updated daily on week days.
Initial download of the metrics may take a while.