Fig. 1
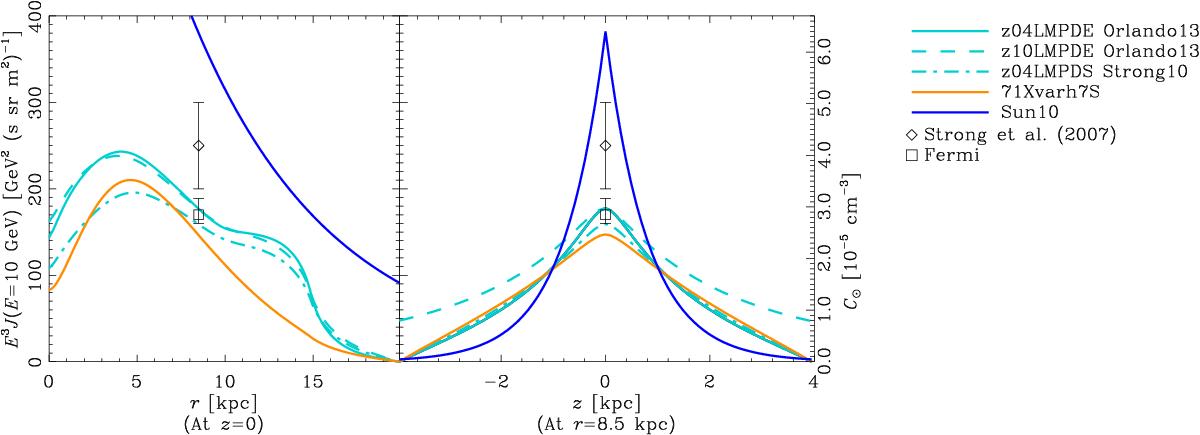
Comparison of CRL distributions. The profile of the CRL density at a reference energy of 10 GeV is shown on the left as a function of Galacto-centric radius for z = 0 and on the right as a function of height at the Solar radius (8.5 kpc). The Sun10 curve does not include the local enhancement described in Sect. 3.2.1. The conversion between the units on the vertical scales at left and right are explained in Jaffe et al. (2010). The diamond and square symbols show the directly-measured CRL fluxes from Strong et al. (2007) and from Ackermann et al. (2010), respectively. (The former point and its error bar are estimated by eye from their Fig. 4.) The “z04LMPDE Orlando13” and “z10LMPDE Orlando13” models are the more recent versions from Orlando13 for different CRL scale heights of 4 and 10 kpc, respectively, while the “z04LMPDS Strong10” is the older version from Strong et al. (2010). (The z04LMPD model extends to | z | = 10 kpc, though the plot is cut off at z = ± 4 kpc.)
Current usage metrics show cumulative count of Article Views (full-text article views including HTML views, PDF and ePub downloads, according to the available data) and Abstracts Views on Vision4Press platform.
Data correspond to usage on the plateform after 2015. The current usage metrics is available 48-96 hours after online publication and is updated daily on week days.
Initial download of the metrics may take a while.