Fig. 6

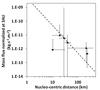
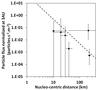
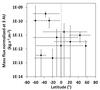
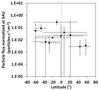
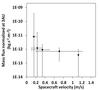
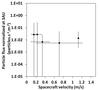
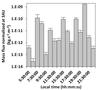
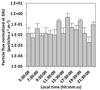
High phase angle (75°–90°) mass fluxes of dust (left column) and particle fluxes (right column) normalized to the solar distance at 3 AU. a), b) Fluxes plotted versus the distance to the comet center. The data are averaged on nucleo-centric distance bins of 10 km. The dashed line represent the ![]() law. c), d) Fluxes plotted versus the latitude. The data are averaged on latitude bins of 10°. e), f) Fluxes plotted versus the spacecraft velocity. The data are averaged on velocity bins of 0.1 m/s. g), h) Fluxes plotted versus local time. The error bars represent the standard deviation in each bin.
law. c), d) Fluxes plotted versus the latitude. The data are averaged on latitude bins of 10°. e), f) Fluxes plotted versus the spacecraft velocity. The data are averaged on velocity bins of 0.1 m/s. g), h) Fluxes plotted versus local time. The error bars represent the standard deviation in each bin.
Current usage metrics show cumulative count of Article Views (full-text article views including HTML views, PDF and ePub downloads, according to the available data) and Abstracts Views on Vision4Press platform.
Data correspond to usage on the plateform after 2015. The current usage metrics is available 48-96 hours after online publication and is updated daily on week days.
Initial download of the metrics may take a while.