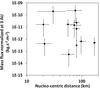
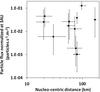
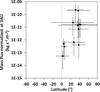
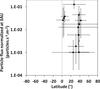
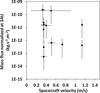
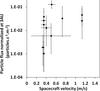
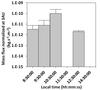
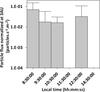
Fig. 5

Low phase angle (0°–45°) mass fluxes of dust (left column) and particle fluxes (right column) normalized to the solar distance at 3 AU and plotted against nucleo-centric distance a), b), latitude c), and d), spacecraft velocity e), f), and local time g), h). The error bars on the mass fluxes are given by using densities of 2500 kg/m3 and 100 kg/m3. The error bars on the particle fluxes represent the 1σ error. For collection periods with low number of particles (less than 100), the error bars are derived from Gehrels (1986).
Current usage metrics show cumulative count of Article Views (full-text article views including HTML views, PDF and ePub downloads, according to the available data) and Abstracts Views on Vision4Press platform.
Data correspond to usage on the plateform after 2015. The current usage metrics is available 48-96 hours after online publication and is updated daily on week days.
Initial download of the metrics may take a while.