Fig. 2
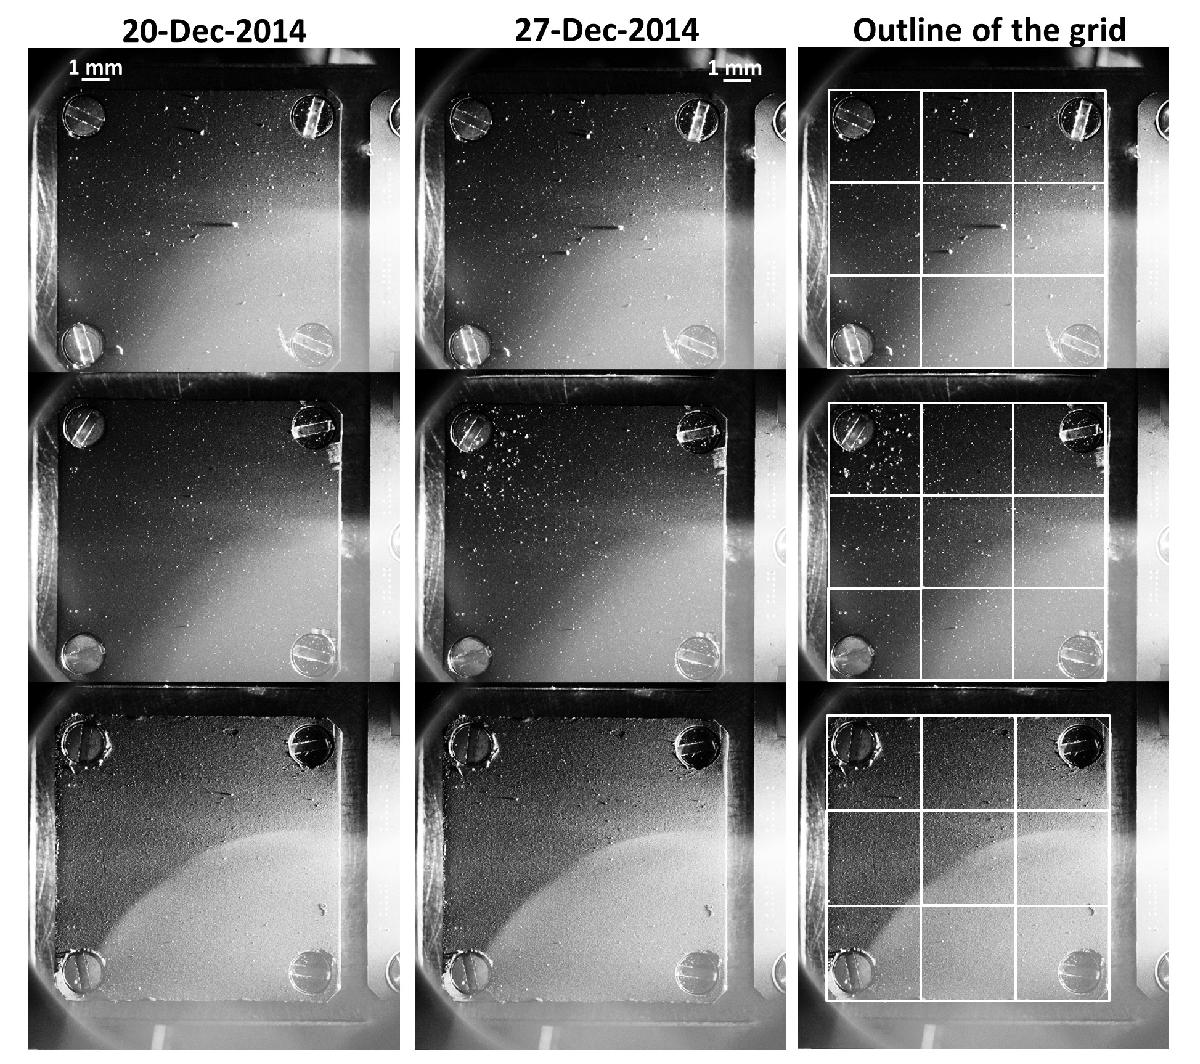
COSISCOPE images of a dust particle fragmentation event. The images on the left show the three targets mounted on one target holder after one week of exposure (images 20-12-2014). The images in the middle show a cluster of particles that has been collected and settled around the screw on the upper left-hand corner of the mid-target after a further week of exposure (images 27-12-2014). Each target was imaged separately, the images are combined here respecting their configuration on the target holder. The images on the right show the grid used to analyze the spatial distribution of the particles (see text for detail).
Current usage metrics show cumulative count of Article Views (full-text article views including HTML views, PDF and ePub downloads, according to the available data) and Abstracts Views on Vision4Press platform.
Data correspond to usage on the plateform after 2015. The current usage metrics is available 48-96 hours after online publication and is updated daily on week days.
Initial download of the metrics may take a while.