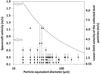
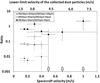
Fig. 11

a) Scatter plot showing the typical size of the collected particles collected at different spacecraft velocities. The arrows represent the collection periods for which no particles have been detected and thus correspond to an upper limit of the size of eventually collected particles (the limit being given by the resolution of the COSISCOPE). In this plot, the particles fragmented on the walls of the funnel are not included. The dashed line represent the v ~ size-0.5 dependence. b) Gray dots: ratio of the number of particles larger than 100 μm/number of particles smaller than 100 μm. White dots: ratio of the number of particles larger than 50 μm/number of particles smaller than 50 μm. The arrows represent null ratios obtained in these two cases for spacecraft velocities larger than 0.5 m/s for which no particles above 50 μm have been collected. Black squares: ratio of the number of particles with sizes comprised between 30 μm and 50 μm/number of particles between 10 μm and 30 μm. In all cases, the error bars represent a 1σ error.
Current usage metrics show cumulative count of Article Views (full-text article views including HTML views, PDF and ePub downloads, according to the available data) and Abstracts Views on Vision4Press platform.
Data correspond to usage on the plateform after 2015. The current usage metrics is available 48-96 hours after online publication and is updated daily on week days.
Initial download of the metrics may take a while.