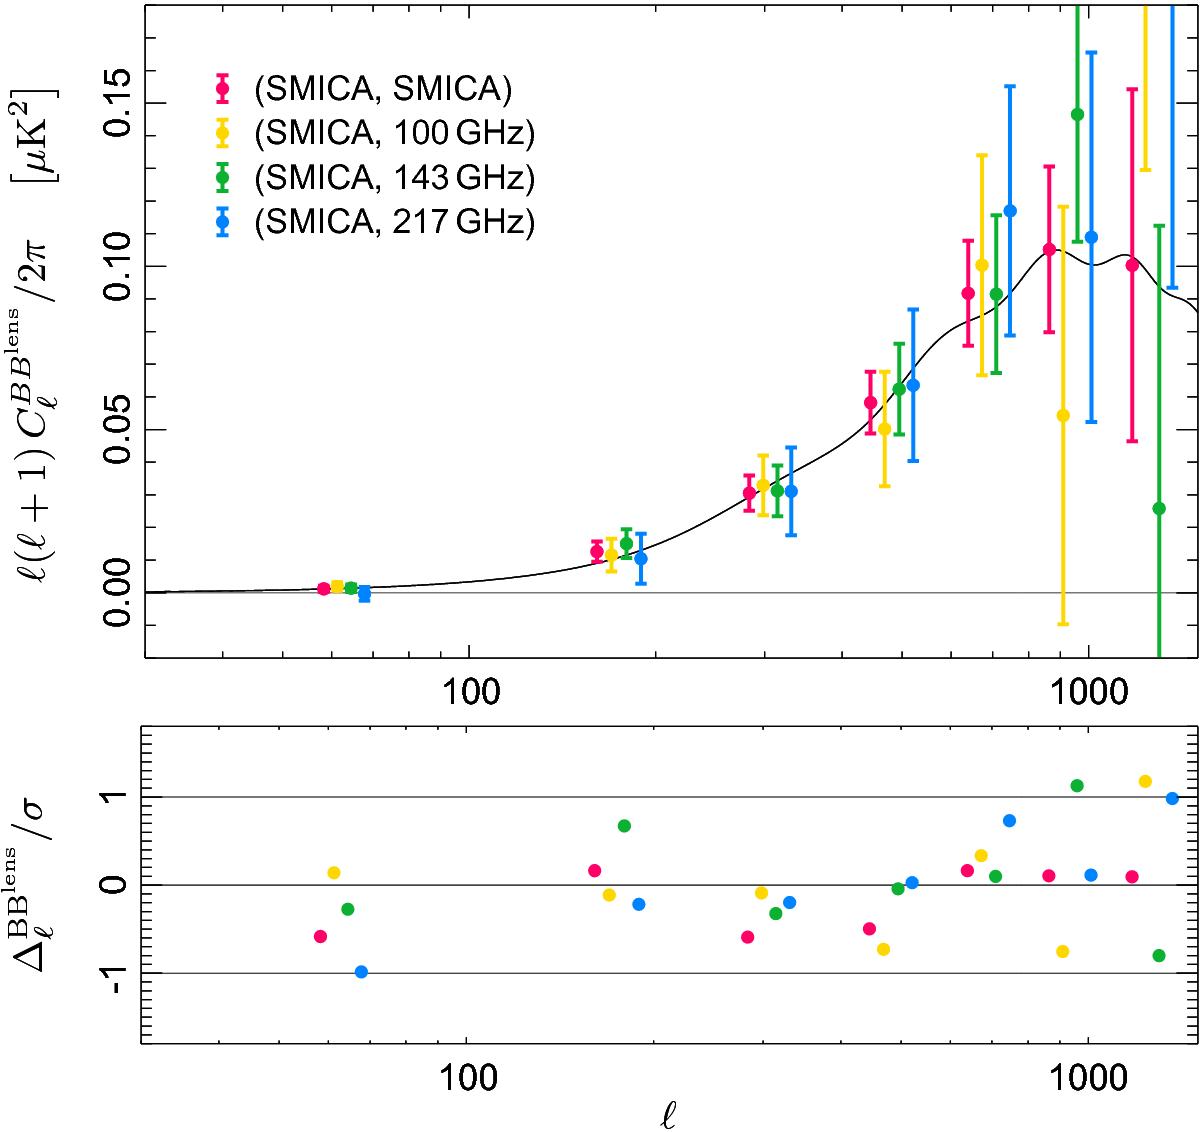
Fig. 9

Stability to the change in the observed polarization map. Data points shown in the upper panel are the BBlens band-powers obtained from the cross-correlation of our SMICAB-mode template with the SMICA polarization map (red), and with single frequency polarization maps at 100 GHz (yellow), 143 GHz (green), and 217 GHz (blue), which were corrected for foreground and intensity-to-polarization leakage. Residuals with respect to the model in units of the 1σ band-power uncertainties are shown in the lower panel.
Current usage metrics show cumulative count of Article Views (full-text article views including HTML views, PDF and ePub downloads, according to the available data) and Abstracts Views on Vision4Press platform.
Data correspond to usage on the plateform after 2015. The current usage metrics is available 48-96 hours after online publication and is updated daily on week days.
Initial download of the metrics may take a while.


