Fig. 2
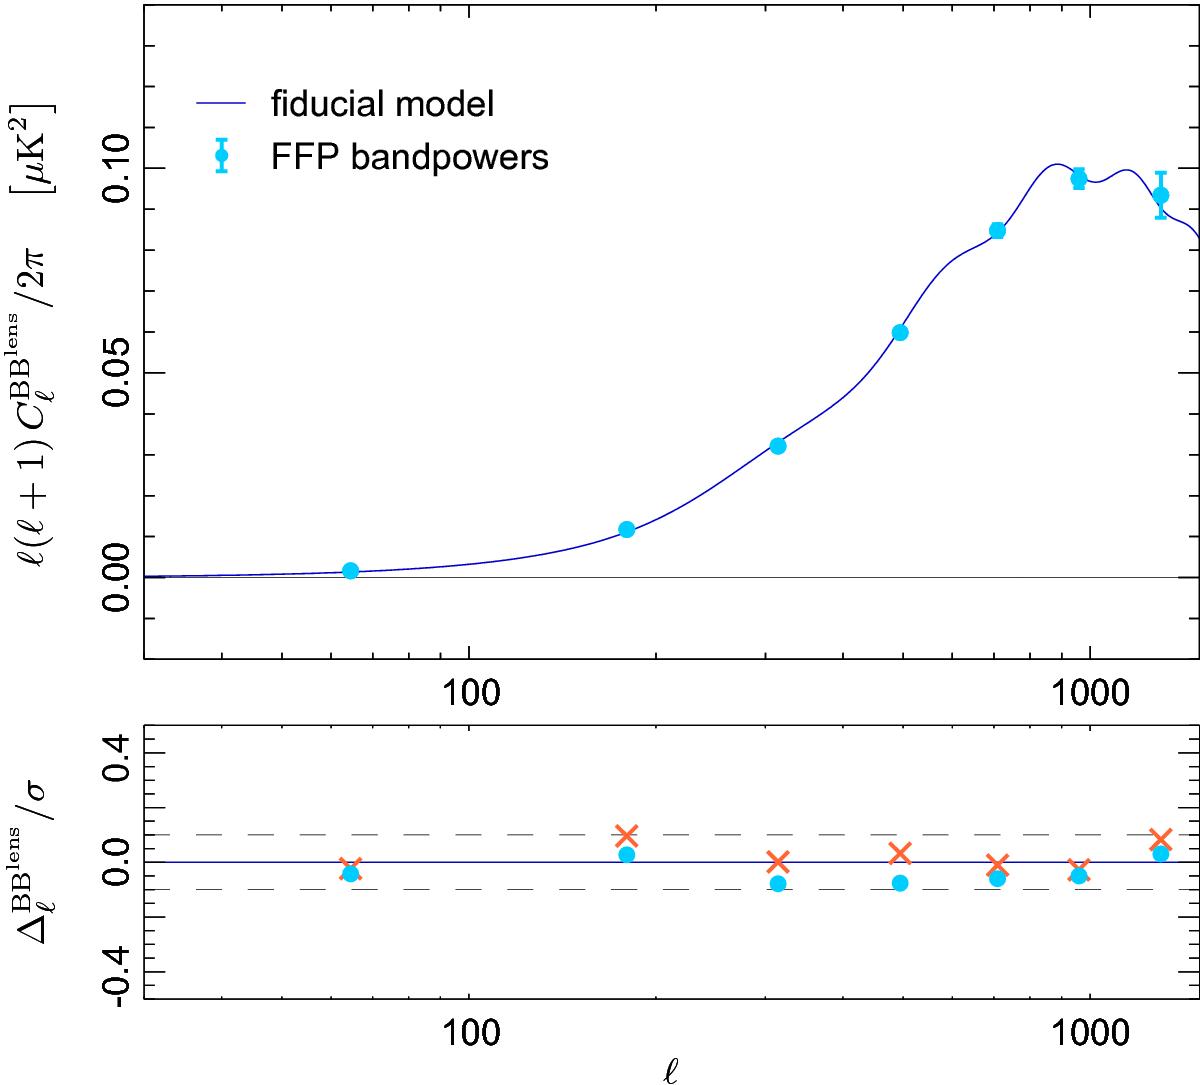
Lensing B-mode power spectrum obtained by cross-correlating the Blens templates with the corresponding fiducial B-mode simulations (top), and residuals with respect to the model (bottom). Top: averaged BBlens band-powers using the apodized B70 template mask, with multipole bins of Δℓ ≥ 100 (blue points). The error bars are the standard deviation on the mean of the band-power estimate set. The dark blue curve is the fiducial B-mode power spectrum of our simulations, which assumes r = 0. Bottom: BBlens band-power residual with respect to the fiducial model, given in units of the 1σ error of a single realization. For comparison, we also show the band-power residuals obtained without masking, as discussed in Sect. 5.1 (red points). Dashed lines show the ± 1σ range of 100 realizations, indicating the precision level to which we are able to test against bias.
Current usage metrics show cumulative count of Article Views (full-text article views including HTML views, PDF and ePub downloads, according to the available data) and Abstracts Views on Vision4Press platform.
Data correspond to usage on the plateform after 2015. The current usage metrics is available 48-96 hours after online publication and is updated daily on week days.
Initial download of the metrics may take a while.