Fig. 10
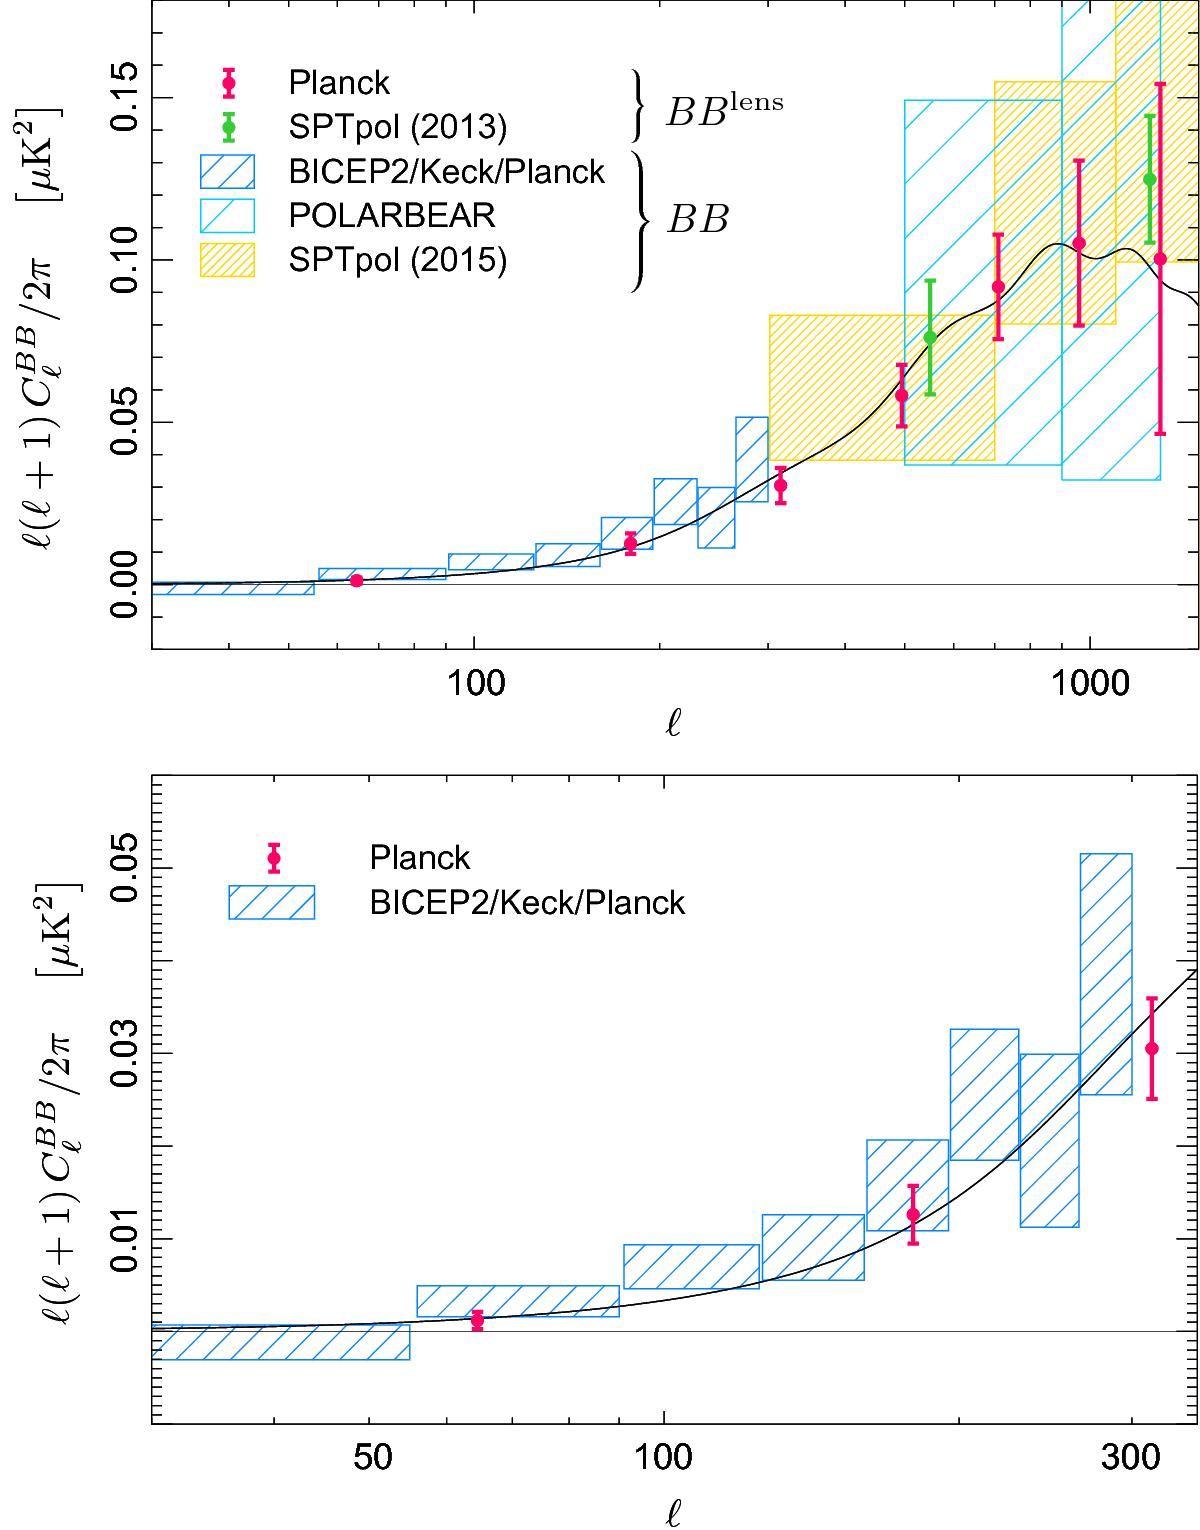
Consistency with external B-mode power spectrum measurements on the full multipole range (top) and at ℓ< 350 (bottom). We compare our baseline BBlens estimate (red points) to the SPTpol template-based results (green points; Hanson et al. 2013); and to the BB power spectrum measurements from BICEP2/Keck Array (blue boxes; BICEP2 and Keck Array Collaborations 2015a), POLARBEAR (light blue boxes; The Polarbear Collaboration 2014), and SPTpol (yellow boxes; Keisler et al. 2015), as discussed in Sect. 7.5. The black line shows the theoretical lensing B-mode power spectrum for the base ΛCDM best-fit Planck model (with r = 0).
Current usage metrics show cumulative count of Article Views (full-text article views including HTML views, PDF and ePub downloads, according to the available data) and Abstracts Views on Vision4Press platform.
Data correspond to usage on the plateform after 2015. The current usage metrics is available 48-96 hours after online publication and is updated daily on week days.
Initial download of the metrics may take a while.