| Issue |
A&A
Volume 596, December 2016
|
|
|---|---|---|
| Article Number | A49 | |
| Number of page(s) | 8 | |
| Section | Catalogs and data | |
| DOI | https://doi.org/10.1051/0004-6361/201527782 | |
| Published online | 28 November 2016 | |
A database of synthetic photometry in the GALEX ultraviolet bands for the stellar sources observed with the International Ultraviolet Explorer⋆
AEGORA Research Group, Universidad Complutense de Madrid, Facultad de CC. Matemáticas, Plaza de Ciencias 3, 28040 Madrid, Spain
e-mail: aig@ucm.es
Received: 18 November 2015
Accepted: 19 September 2016
Context. The Galaxy Evolution Explorer (GALEX) has produced the largest photometric catalogue of ultraviolet (UV) sources. As such, it has defined the new standard bands for UV photometry: the near UV band (NUV) and the far UV band (FUV). However, due to brightness limits, the GALEX mission has avoided the Galactic plane which is crucial for astrophysical research and future space missions.
Aims. The International Ultraviolet Explorer (IUE) satellite obtained 63 755 spectra in the low dispersion mode (λ/δλ ~ 300) during its 18-year lifetime. We have derived the photometry in the GALEX bands for the stellar sources in the IUE Archive to extend the GALEX database with observations including the Galactic plane.
Methods. Good quality spectra have been selected for the IUE classes of stellar sources. The GALEX FUV and NUV magnitudes have been computed using the GALEX transmission curves, as well as the conversion equations between flux and magnitudes provided by the mission.
Results. Consistency between GALEX and IUE synthetic photometries has been tested using white dwarfs (WD) contained in both samples. The non-linear response performance of GALEX inferred from this data agrees with the results from GALEX calibration. The photometric database is made available to the community through the services of the Centre de Données Stellaires at Strasbourg (CDS). The catalogue contains FUV magnitudes for 1628 sources, ranging from FUV = 1.81 to FUV = 18.65 mag. In the NUV band, the catalogue includes observations for 999 stars ranging from NUV = 3.34 to NUV = 17.74 mag.
Conclusions. UV photometry for 1490 sources not included in the GALEX AIS GR5 catalogue is provided; most of them are hot (O-A spectral type) stars. The sources in the catalogue are distributed over the full sky, including the Galactic plane.
Key words: astronomical databases: miscellaneous / catalogs / surveys / ultraviolet: stars
Full Tables A.1 and B.1 are only available at the CDS via anonymous ftp to cdsarc.u-strasbg.fr (130.79.128.5) or via http://cdsarc.u-strasbg.fr/viz-bin/qcat?J/A+A/596/A49
© ESO, 2016
1. Introduction
The catalogue of ultraviolet (UV) sources generated by the Galaxy Evolution Explorer1 (GALEX) mission constitutes the most extensive database of UV photometry (Martin et al. 2005, hereafter Ma2005; Bianchi 2014, hereafter B2014). As such, the GALEX near ultraviolet or NUV band and far ultraviolet or FUV band, have become standards for the description of the spectral energy distribution (SED) of sources in broad band photometry. The NUV band ranges from 1771 Å to 2831 Å, with an effective wavelength of 2315.7 Å, and the FUV band ranges from 1344 Å to 1786 Å with an effective wavelength of 1538.6 Å (Morrissey et al. 2007, hereafter M2007).
The UV detectors used by the GALEX mission were sensitive Microchannel Plate (MCP) type detectors with a global count rate limit of 100 000 counts s-1 (M2007). As a result, the GALEX survey avoided the Galactic plane (B2014). Moreover, the photometric database does not extend to bright UV sources that are ideally suited for calibration purposes.
The International Ultraviolet Explorer (IUE) (Boggess et al. 1978, herefater B1978) contains the largest data set of UV spectra. Most of them were obtained in photometric conditions: good guiding, large aperture (10 × 20 arcsec), and low dispersion (λ/δλ ~ 300). We have used this spectral data base to compute the FUV and NUV synthetic magnitudes of stellar sources observed with IUE under this configuration (31 982 spectra).
In this research note, we describe the methods followed to derive the FUV and NUV magnitudes from the IUE spectra, and quantify the photometric accuracy of these results by comparing GALEX and IUE-based photometry for the white dwarfs (WDs) contained in both samples. We also describe the contents and characteristics of the database available at the Centre de Données Stellaires at Strasbourg (CDS).
2. The IUE database of stellar spectra
The IUE database contains 63 755 spectra obtained through the large aperture (10 × 20 arcsec) in low dispersion mode; from those, we have selected only the stellar sources2. This amounts to a grand total of 31 982 stellar spectra3.
The IUE low dispersion spectra were recorded with three cameras: long wavelength prime (LWP), long wavelength redundant (LWR), and short wavelength prime (SWP) (B1978). From the 31 982 stellar spectra, 16 467 are SWP observations, 10 349 are LWP observations, and 5166 are LWR observations. Good quality spectra (according to the criteria defined in Sect. 4) are available for 1889 stars in the SWP camera and 1157 stars in the LWP or LWR cameras.
3. The GALEX photometric bands in the IUE spectra
GALEX was a 50-cm primary space telescope with a Ritchey-Chrétien mounting, simultaneously feeding two detectors sensitive to near and far UV making use of a multilayer dichroic beamsplitter (Morrissey et al. 2005, Ma2005). The GALEX photometric bands are defined in the mission documentation (M2007) and can be downloaded from the GALEX official webpage4. The FUV and NUV bands cover the spectral ranges 1344−1786 Å and 1771−2831 Å respectively (M2007); the transmittance curves are shown in Fig. 1. FUV and NUV AB magnitudes are determined by means of the conversion: ![\begin{eqnarray} &&\text{FUV} = -2.5 \times \log \bigg( \frac{\text{Flux \, FUV}}{1.40 \times 10^{-15} \, {\text{erg} \,\text{s}}^{-1}~{\text{cm}}^{-2}~ {\AA}^{-1}} \bigg) + 18.82 ~~~~~~~~~~~~~ \label{eq:FUV} \\[2mm] && \text{NUV} = -2.5 \times \log \bigg( \frac{\text{Flux \, NUV}}{2.06 \times 10^{-16} \, {\text{erg} \,\text{s}}^{-1}~{\text{cm}}^{-2}~ {\AA}^{-1}} \bigg) + 20.08 ~~~~~~~~~~~~~ \label{eq:NUV} \end{eqnarray}](/articles/aa/full_html/2016/12/aa27782-15/aa27782-15-eq7.png) (M2007).
(M2007).
The IUE long (1850−3300 Å) and short (1150−1980 Å) wavelength ranges (B1978) do not match exactly the GALEX bands. While GALEX FUV is completely contained in the IUE SW range, GALEX NUV is split between the LW and SW cameras. For this reason, we need to join SWP and LW spectra in order to compute NUV magnitudes. Therefore NUV photometry can only be provided for non-variable sources.
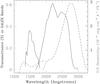 |
Fig. 1 GALEX transmission curves (solid) compared with IUE sensitivity curves (dashed) for the SWP and LWR cameras from Bohlin et al. (1980). |
4. Methods
4.1. Data selection
Spectra have been retrieved from the IUE Newly Extracted Spectra (INES) Archive; data in this archive were processed using an optimised extraction algorithm that prevents the introduction of artefacts during the extraction while preserving the photometric accuracy (see Rodríguez-Pascual et al. 1999, for more details). The INES Archive is a final release from the European IUE Observatory.
The spectra are provided as FITS files binary tables that include four columns with: Wavelength (Å), Flux (erg cm-2 s-1 Å -1), Flux error (erg cm-2 s-1 Å -1) after pipeline processing5, and Quality Flag (QF), a quality measure for each pixel. QF = 0 indicates that the pixel flux is reliable, otherwise QF < 0. Negative QFs are given in powers of 2 (QF = −2n with n = 1...14) and n is an identifier of the various possible sources of inaccuracies in the pixel photometry: microphonic noise, saturated pixel, reseaux mark, and others6.
The database contains all data including overexposed or underexposed spectra as well as observations that suffered problems during the downlink, calibration, processing and other processes. To avoid including bad spectra in the photometric database, we removed from our list:
-
spectra with more than 10% of the pixels in the IUE spectrumflagged with QF< 0. The vast majority of the spectra contain reseau marks for the geometric calibration of the raw data and pixels flagged with QF < 0 close to the edge of the spectrum. For this reason we have worked with a tolerance of 10%;
-
spectra with average Flux smaller than three times the average Flux error in the corresponding GALEX wavelength range. Calibrated data include flux and flux error at each wavelength; this is the standard 3σ criterium applied to remove underexposed spectra from the working list.
LW spectra require a more detailed examination since the peak transmittance of the GALEX NUV filter is at 2300 Å, in an area often underexposed in the spectrum of the cool stars observed with the IUE. To evaluate the Signal-to-Noise Ratio (SNR) in this region, we define four windows in the 1975−2375 Å range: REG I (1975−2075 Å), REG II (2075−2175 Å), REG III (2175−2275 Å), and REG IV (2275−2375 Å). Within these windows we compute the mean flux and the dispersion. We reject the spectra if the mean flux is negative or if the standard deviation is ten times higher than the mean in any of the regions II-III-IV. We allow for a factor of ten to prevent removing sources with steep energy distributions or strong features.
4.2. Calculation of the FUV and NUV synthetic magnitudes
The integrated flux in the FUV band is computed from the SWP IUE spectra after multiplication by the normalised transmittance of the FUV filter. The flux of the flagged bad pixels (QF < 0) has been interpolated from good nearby pixels. The AB magnitude is calculated using Eq. (1) (see Sect. 3).
To evaluate the NUV synthetic magnitude, it is first necessary to determine whether the sources are variable (see Sect. 4.4 for a description of the procedure). In case there is no evidence of variability, the SW and LW are joined into a single spectrum; the matching wavelength is set at 1975 Å. After this, the spectrum is multiplied by the normalised transmittance of the NUV filter. The flux of the flagged bad pixels (QF < 0) has been interpolated from good nearby pixels. The AB magnitude is calculated using Eq. (2) (see Sect. 3). In case there are multiple observations and the source is found not to vary, synthetic magnitudes are computed from the average flux.
4.3. Error determination
For each spectrum and band, the Flux error provided by the mission (Col. #3 in the data) is multiplied by the GALEX normalised transmittance to evaluate the total error in each band denoted as SFUV and SNUV for the FUV and NUV bands respectively. From that, magnitude errors are provided for the FUV band, eFUV+, and eFUV−, and NUV band, eNUV+, and eNUV−; the errors are asymmetric around the magnitude value because of the logarithmic scale. In case there are multiple observations and the source is found not to vary, errors are from the Flux errors.
4.4. Multiple observations. Variable stars
There are 598 stars in the IUE archive with multiple observations in the SW range and 409 stars with multiple observations in the LW range. For those, variability has been tested.
4.4.1. Stars with multiple observations in the IUE SW range
We compute for each SWP observation, i, the weighted flux in the GALEX FUV band, FFUV(i), calculated as:  (3)with GFUV being the normalised GALEX FUV transmission curve (see Fig. 1). The weighted Flux error, SFUV(i), is determined in the same manner:
  (4)with SFUV(i) being the Flux error (see Fig. 1).
After this, the average ⟨ FFUV ⟩, the dispersion σ(FFUV), and the average Flux error ⟨ SFUV ⟩ are computed. We flag a star as variable if σ(FFUV) ≥ 3 × ⟨ SFUV ⟩. Very noisy data have already been rejected in the data selection process (see Sect. 4.1).
Synthetic photometry in the GALEX bands of WD observed with IUE: WDs with GALEX counterpart.
4.4.2. Stars with multiple observations in the IUE LW range
The procedure is similar to that described for the SW range but, in this case, the variability test is carried out only over the range of the NUV band contained in the LW images.
We compute for each LW observation, i, the weighted flux in the 1975−3000 Å range, FGaLW(i), calculated as:  (5)with GNUV being the normalised GALEX NUV transmission curve (see Fig. 1), as well as the weighted Flux error, SGaLW(i),
  (6)The average ⟨ FGaLW ⟩, the dispersion σ(FGaLW), and the average Flux error ⟨ SGaLW ⟩ are then computed. We flag a star as variable if σ(FGaLW) ≥ 3 × ⟨ SGaLW ⟩.
4.4.3. In summary
According to these criteria, 52 stars are found to be variable in the LW range and 88 in the SW range; only 36 stars are found to be variable in both ranges. Therefore, ~13% of the stars with multiple observations in the LW range are found to be variable and ~15% of the stars with multiple observations in the SW range are found to be variable.
An additional search for variable sources was carried out by comparing the fluxes in the window where SW and LW spectra overlap for every source. Three additional stars have been identified as variables from this test, namely HD 37209, HD 56014, and HD 14399, and have been excluded from the catalogue.
5. Photometric accuracy
The IUE sample (of non-variable stars) provides good synthetic photometry for 103 WDs. 43 of these 103 WDs have a counterpart in the GALEX GR5 AIS survey (Bianchi et al. 2011) within a search radius of 3′′. We have used this subset to check the photometric accuracy of the synthetic magnitudes computed in this work (see Table 1 for their synthetic and GALEX magnitudes). The limiting magnitude of GALEX AIS7 (NUV ~ 20.5 mag) is high above the sensitivity threshold of IUE in low dispersion mode; therefore counterparts are identified for all sources within the area mapped by GALEX. We note that in May 2009, the FUV detector in GALEX stopped working and as a result, releases later to GR5 (such as GR6/7) only add new sources in the NUV band8 (B2014).
As shown in Fig. 2, GALEX- and IUE-based UV photometries compare well except for the brightest sources; GALEX photometry is affected by photon count loses at high count rates. Following Camarota & Holberg (2014, hereafter CH), we have fitted the samples to a quadratic function using the least-squares method:  (7)with MGAL the WD magnitude as per the GALEX AIS catalogue and MIUE the IUE-based synthetic magnitude derived in this work. The coefficients of the fit, c0, c1, and c2, are given in Table 2. We found a very good agreement with CH’s fits in the FUV photometry and a significant discrepancy in the NUV band that we ascribe to a possible typographic error in the parameters in CH’s Table 2. The FUV and NUV synthetic photometry for the rest of the WDs in the IUE sample is provided in Table 3.
 |
Fig. 2 IUE versus GALEX photometry for the WDs sample. The dotted line represents the 1:1 correspondence, the solid line represents the fit in Table 2 and the dashed line represents CH’s fit. |
6. The catalogue
The catalogue contains FUV magnitudes for all stars (with and without multiple observations) and NUV magnitudes only for non-variable stars, or stars with just one good observation, as pointed out in Sect. 4.2. The number of observations used for the variability evaluation are indicated for all catalogue entries; ~ 65% of the sources have only one good observation.
Appendix A contains an excerpt of the catalogue available at the CDS. For each source, the following entries are provided:
-
Object identification in the IUE Archive.
-
Right Ascension and Declination (ICRS).
-
Number of SWP observations used to compute FUV.
-
Synthetic FUV magnitude (Eq. (4)) computed from the mean flux, if several observations are used (see Sect. 4.2).
-
Error in the synthetic FUV magnitude computed from the mean flux and error (see Sect. 4.3).
-
Number of LW observations used to compute NUV.
-
Synthetic NUV magnitude (obtained from SWP and LW mean fluxes).
-
Error in the synthetic NUV magnitude (obtained from SWP and LW mean fluxes).
For the 88 stars found to be variable in the SW range, additional entries are provided in a supplementary catalogue (an excerpt is shown in Appendix B) with the FUV synthetic magnitude for each observation (see Sect. 4.4). The following entries are provided:
-
Object identification in the IUE Archive.
-
Right Ascension and Declination (ICRS).
-
Observation date and time.
-
Synthetic FUV magnitude computed from the flux.
-
Error in the synthetic FUV magnitude computed from the flux and error.
The catalogue contains synthetic FUV magnitudes for 1628 sources, ranging from FUV = 1.81 to FUV = 18.65. In the NUV band, the catalogue includes observations for 999 stars ranging from NUV = 3.34 to NUV = 17.74 mag. The distribution of sources in the sky is plotted in Fig. 3; we highlight the good coverage of the Galactic plane. A summary statistics of the catalogue contents is available in Table 4. This work adds UV photometry for 1490 new sources, most of them hot (O-A spectral type) stars. The catalogue is available to the community through the services of the Centre de Données Stellaires.
Quadratic fit parameters for the WDs sample.
Synthetic photometry in the GALEX bands of WDs observed with IUE: that is, WDs without GALEX counterpart.
 |
Fig. 3 Distribution in the sky of the sources in the catalogue. Variable sources (as per the criteria in Sect. 4.4) are indicated with filled circles. |
Catalogue contents.
7. Conclusions
From an initial sample of 31 982 stellar IUE spectra, we computed the synthetic photometry for:
-
1628 sources in the GALEX FUV band with magnitudes rangingfrom FUV = 1.81 to FUV = 18.65.
-
999 sources in the GALEX NUV band with NUV ranging from NUV = 3.34 to NUV = 17.74 mag.
The FUV and NUV synthetic photometry compares well with GALEX. A sample of WD’s observed with IUE and GALEX were used for the test; a good agreement with CH was found for the FUV band but not for the NUV band.
The catalogue is available to the community through the services of the Centre de Données Stellaires. It adds UV photometry for 1490 new sources with respect to the GALEX AIS catalogue, most of them hot (O-A spectral type) stars. The sources in the catalogue are distributed over the full sky, including the Galactic plane.
See https://archive.stci.eduiue/manual/newsips/node20.html for details.
Acknowledgments
We want to thank the referee for his/her comments which improved this paper. this work has been supported by the Ministry of Economy and Competitiveness of Spain through grants: AYA2011-29754-c3-01, ESP2014-54243-R. Leire Beitia-Antero acknowledges the receipt of a “Beca de Colaboración” from the Ministry of Education of Spain.
References
- Bianchi, L. 2014, Ap&SS, 304, 103 [NASA ADS] [CrossRef] [Google Scholar]
- Bianchi, L., Herald, J., Efremova, B., et al. 2011, Ap&SS, 335, 161 [NASA ADS] [CrossRef] [Google Scholar]
- Boggess, A., Carr, F. A., Fischel, D., et al. 1978, Nature, 275, 372 [NASA ADS] [CrossRef] [Google Scholar]
- Bohlin, R. C., Holm, A. V., Savage, D. V., et al. 1980, A&A, 85, 1 [NASA ADS] [Google Scholar]
- Camarota, L., & Holberg, J. B. 2014, MNRAS, 438, 3111 [NASA ADS] [CrossRef] [Google Scholar]
- Martin, D. C., Fanson, J., Schiminovich, D., et al. 2005, ApJ, 619, L1 [Google Scholar]
- Morrissey, P., Schiminovich, D., Barlow, T. A., et al. 2005, ApJ, 619, L7 [NASA ADS] [CrossRef] [Google Scholar]
- Morrissey, P., Conrow, T., Barlow, T. A., et al. 2007, ApJS, 173, 682 [NASA ADS] [CrossRef] [Google Scholar]
- Rodríguez-Pascual, P., Gonzalez-Riestra, R., Schartel, N., et al. 1999, A&AS, 139, 183 [NASA ADS] [CrossRef] [EDP Sciences] [Google Scholar]
Appendix A: Catalogue excerpt
An excerpt (first ten entries) of the catalogue is shown in Table A.1 (see Sect. 6, for a detailed description of the fields). The full catalogue is available at the CDS.
Catalogue layout (first ten entries).
Appendix B: FUV magnitude – variable stars
An excerpt (first ten entries) of the list of FUV magnitudes for variable stars is shown in Table B.1 (see Sect. 6 for a description of the fields). The full table is available at the CDS.
FUV magnitude for variable stars layout (first ten entries).
All Tables
Synthetic photometry in the GALEX bands of WD observed with IUE: WDs with GALEX counterpart.
Synthetic photometry in the GALEX bands of WDs observed with IUE: that is, WDs without GALEX counterpart.
All Figures
|
Fig. 1 GALEX transmission curves (solid) compared with IUE sensitivity curves (dashed) for the SWP and LWR cameras from Bohlin et al. (1980). |
| In the text | |
|
Fig. 2 IUE versus GALEX photometry for the WDs sample. The dotted line represents the 1:1 correspondence, the solid line represents the fit in Table 2 and the dashed line represents CH’s fit. |
| In the text | |
|
Fig. 3 Distribution in the sky of the sources in the catalogue. Variable sources (as per the criteria in Sect. 4.4) are indicated with filled circles. |
| In the text | |
Current usage metrics show cumulative count of Article Views (full-text article views including HTML views, PDF and ePub downloads, according to the available data) and Abstracts Views on Vision4Press platform.
Data correspond to usage on the plateform after 2015. The current usage metrics is available 48-96 hours after online publication and is updated daily on week days.
Initial download of the metrics may take a while.