Fig. 9
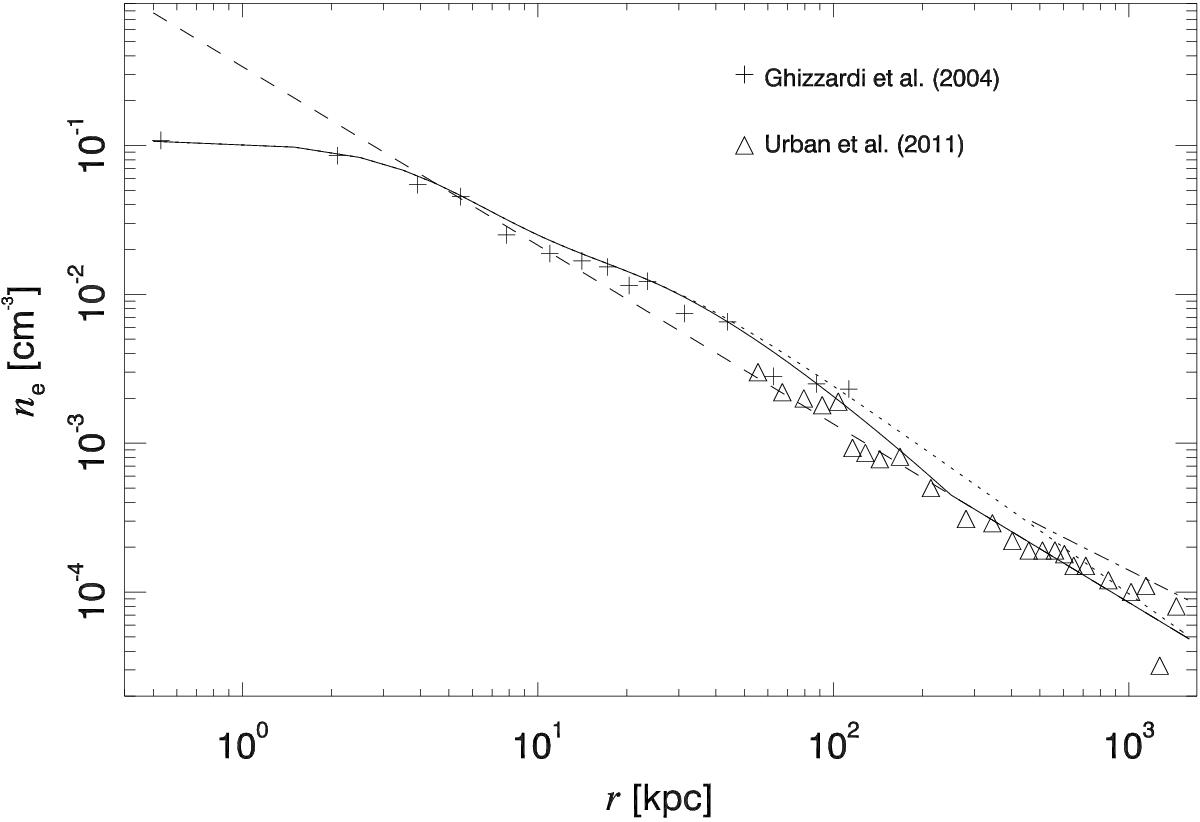
Electron density profile of Virgo derived from Chandra and XMM-Newton data. The dotted and dashed lines correspond to the fits derived by G04 and U11, while the solid line shows the hybrid model adopted in this paper, combining the features from the G04 and U11 models. The dot-dashed line shows an alternative model that extends the G04 model beyond 500 kpc with an r-1 power law. Error bars are omitted for clarity.
Current usage metrics show cumulative count of Article Views (full-text article views including HTML views, PDF and ePub downloads, according to the available data) and Abstracts Views on Vision4Press platform.
Data correspond to usage on the plateform after 2015. The current usage metrics is available 48-96 hours after online publication and is updated daily on week days.
Initial download of the metrics may take a while.