Fig. 8
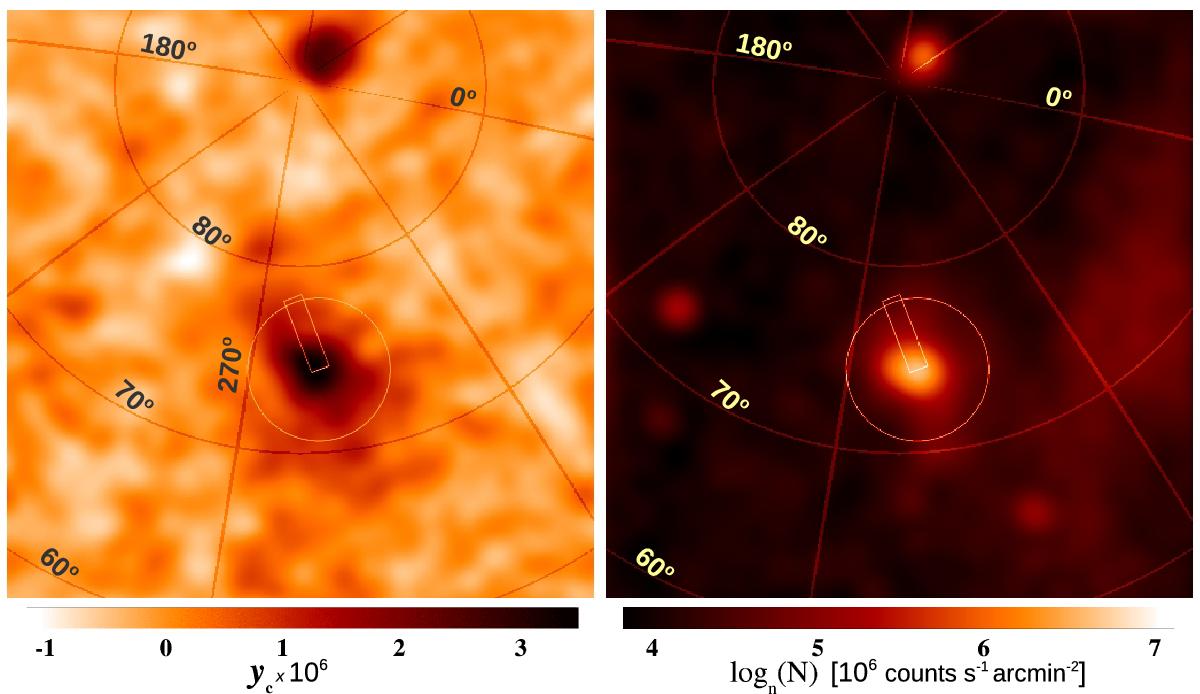
Left: SZ map (stripe-reduced version) in units of the Compton parameter. Right: ROSAT All Sky Survey map in Logarithmic scale (in units of 106 counts s-1 arcmin-2). We indicate the sector (rectangular region) where XMM-Newton pointings were used by Urban et al. (2011) to derive the electron density and temperature up to the virial radius (circle).
Current usage metrics show cumulative count of Article Views (full-text article views including HTML views, PDF and ePub downloads, according to the available data) and Abstracts Views on Vision4Press platform.
Data correspond to usage on the plateform after 2015. The current usage metrics is available 48-96 hours after online publication and is updated daily on week days.
Initial download of the metrics may take a while.