Fig. 7
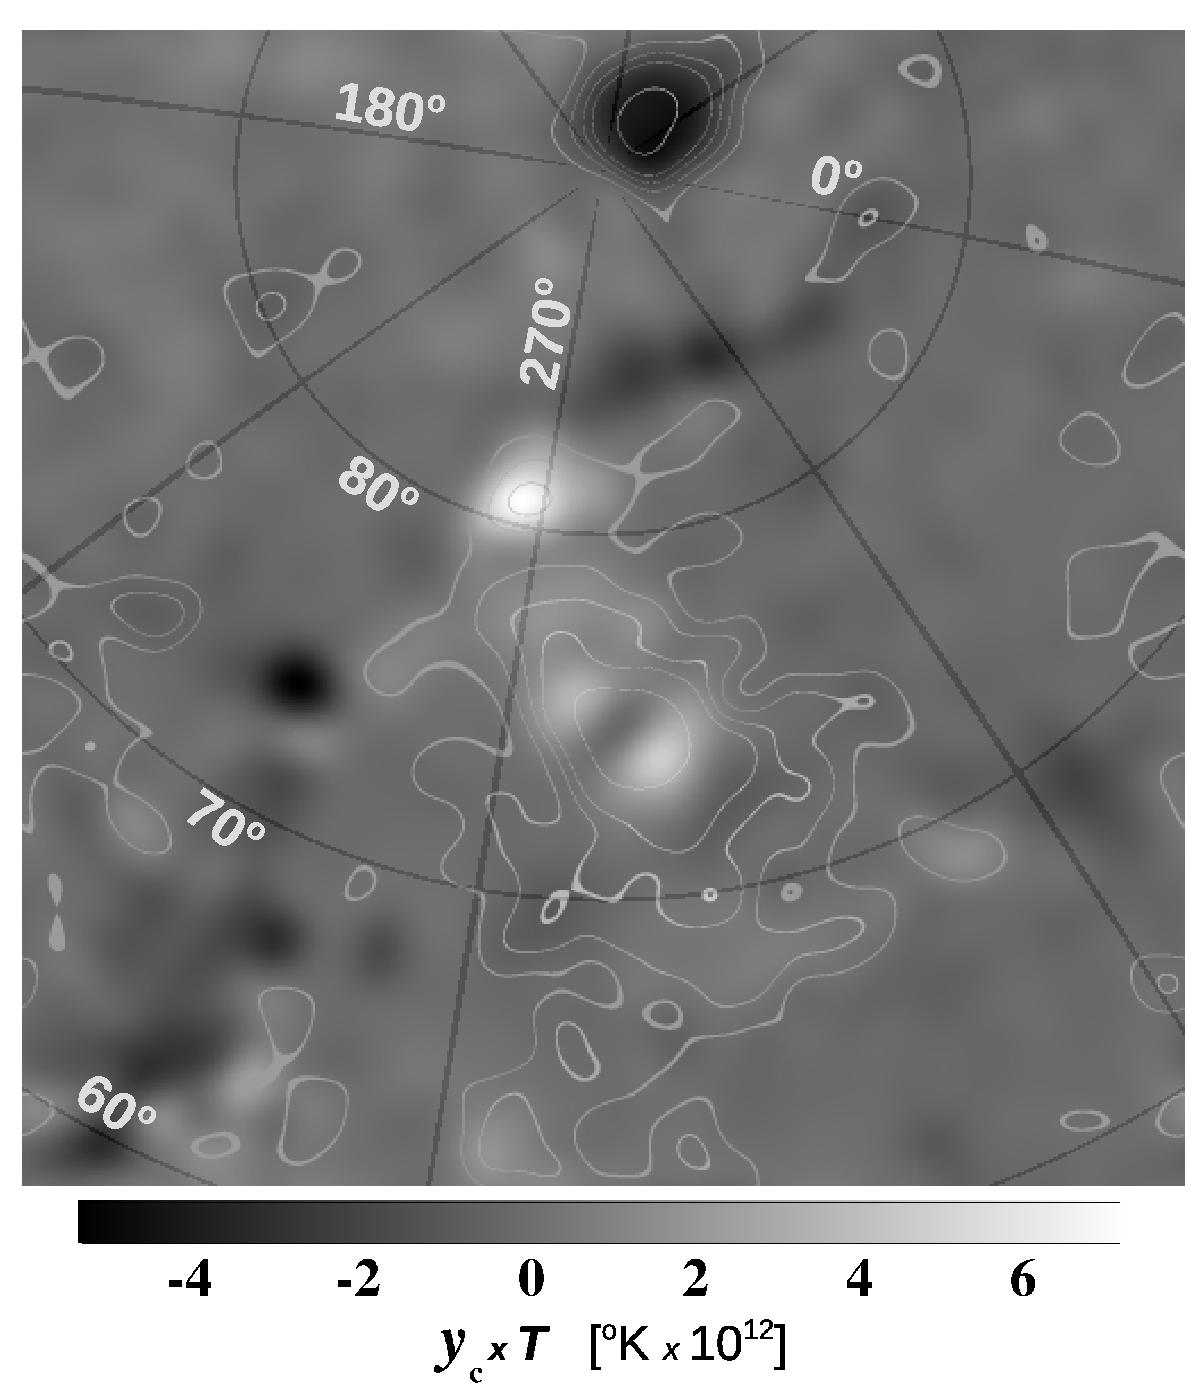
Map showing the correlation between the SZ map and the dust map. The brighter areas show the regions where the correlation between the two maps is positive, while the darker areas show areas with anti-correlation. Overlaid are the same SZ effect contours as in Fig. 6. The units are arbitrary and re-scaled by a factor of 1012, but correspond to the dimensionless Compton parameter times temperature.
Current usage metrics show cumulative count of Article Views (full-text article views including HTML views, PDF and ePub downloads, according to the available data) and Abstracts Views on Vision4Press platform.
Data correspond to usage on the plateform after 2015. The current usage metrics is available 48-96 hours after online publication and is updated daily on week days.
Initial download of the metrics may take a while.