Fig. 6

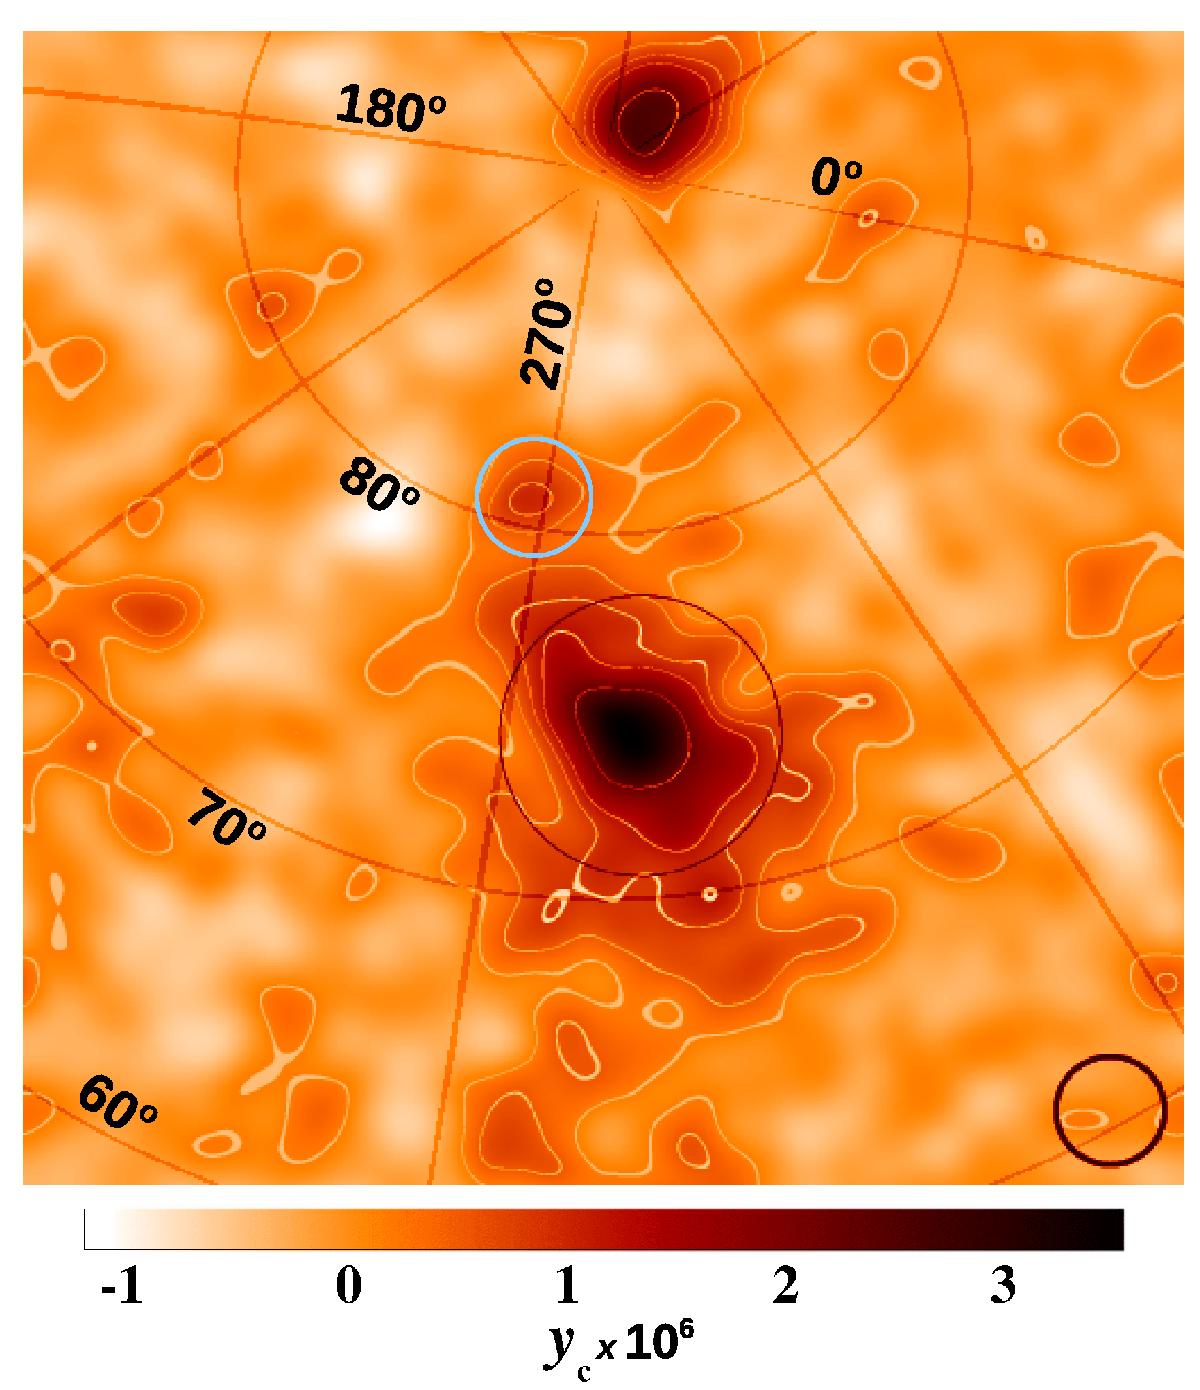
SZ effect map obtained after combining the individual maps in Fig. 4 and after reducing the impact of stripes (see Appendix A). The colour scale is the same as in Fig. 5. The contours are proportional to 1, 2, 3, 4, and 7 times the dispersion of the background. We only show the contours for the positive (negative in the map) fluctuations of the Compton parameter. Virgo’s centre (M 87) is 4deg south of the centre of the image and the Coma cluster is clearly seen at the top (i.e., north). Other clusters like the Leo cluster (or group) can also be appreciated near the east edge of the image (in the middle). The big black circle around Virgo marks the area enclosed within the virial radius (![]() ). The small circle at the bottom right has a diameter equal to the FWHM of the Gaussian kernel used to smooth the image (
). The small circle at the bottom right has a diameter equal to the FWHM of the Gaussian kernel used to smooth the image (![]() ). The small light-blue circle at ℓ ≈ 270°,b ≈ 80° marks the position of a feature in the SZ map that is possibly due to Galactic contamination. The field of view is
). The small light-blue circle at ℓ ≈ 270°,b ≈ 80° marks the position of a feature in the SZ map that is possibly due to Galactic contamination. The field of view is ![]() .
.
Current usage metrics show cumulative count of Article Views (full-text article views including HTML views, PDF and ePub downloads, according to the available data) and Abstracts Views on Vision4Press platform.
Data correspond to usage on the plateform after 2015. The current usage metrics is available 48-96 hours after online publication and is updated daily on week days.
Initial download of the metrics may take a while.


