Fig. 3
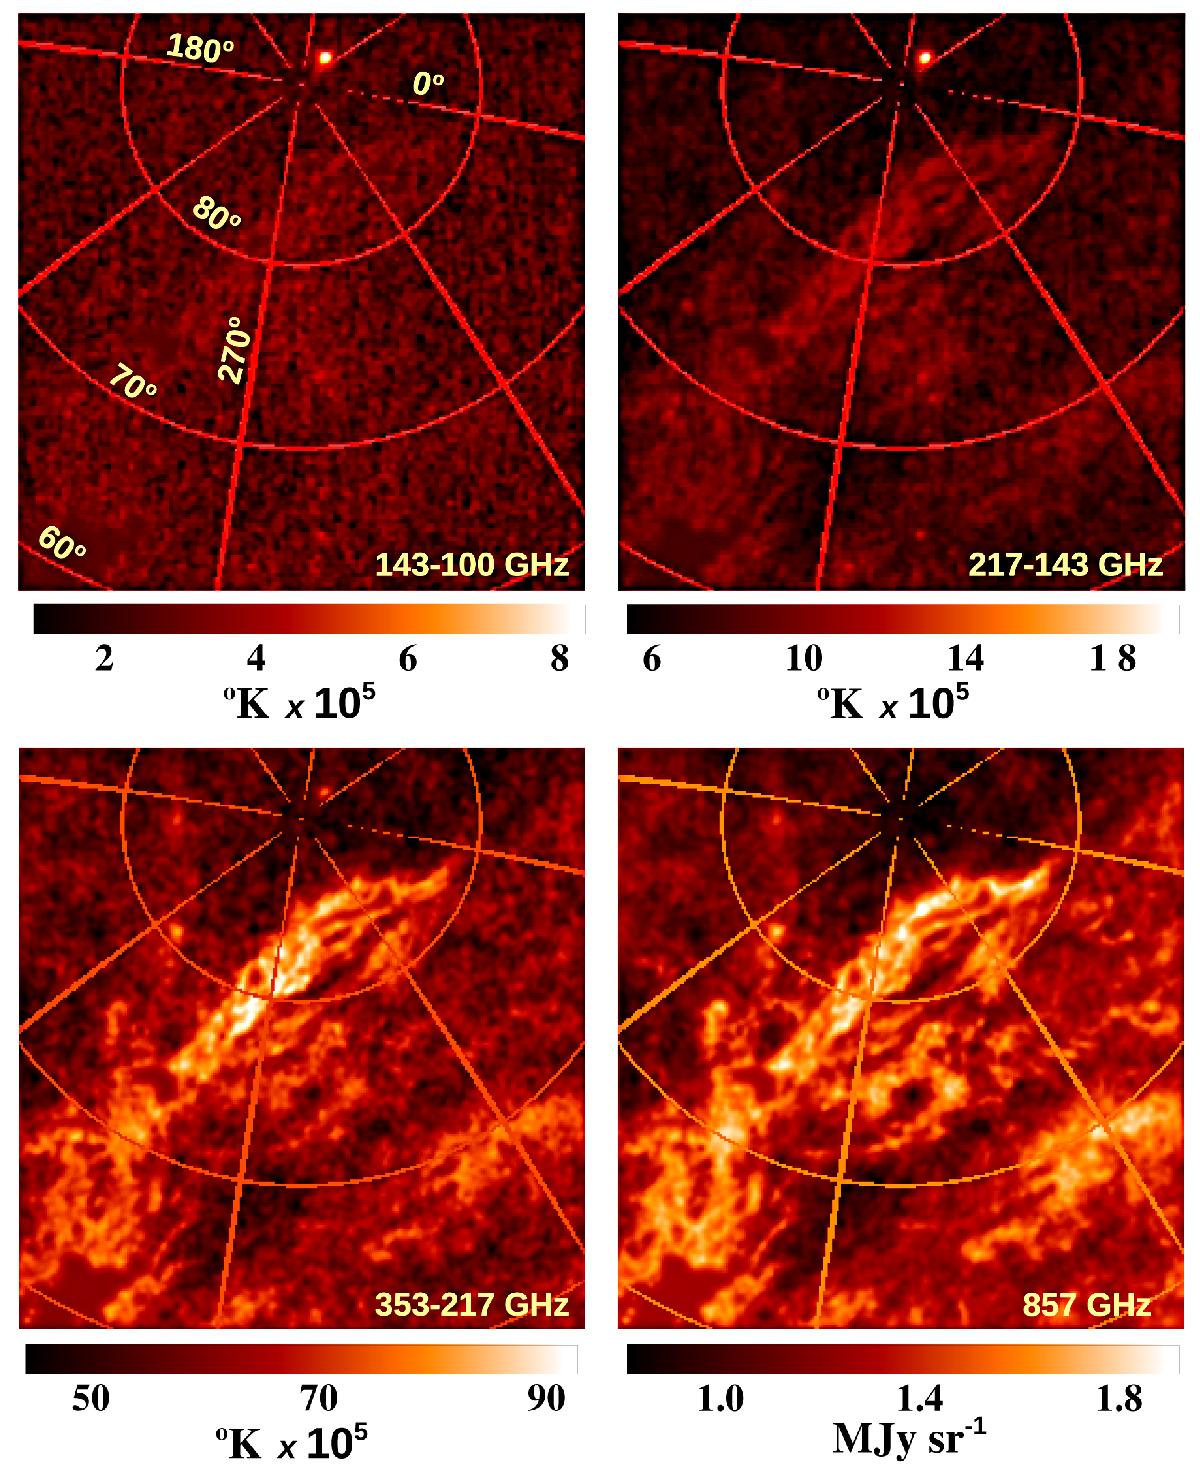
Differences (in kelvin) between the individual Planck bands. The lower right panel shows the original data at 857 GHz (in MJy sr-1). All maps have been masked and degraded to the same resolution before calculating the differences. In all differences the SZ effect should appear as a positive signal. The Coma cluster is clearly visible in the top of the images of the low-frequency differences.
Current usage metrics show cumulative count of Article Views (full-text article views including HTML views, PDF and ePub downloads, according to the available data) and Abstracts Views on Vision4Press platform.
Data correspond to usage on the plateform after 2015. The current usage metrics is available 48-96 hours after online publication and is updated daily on week days.
Initial download of the metrics may take a while.