Fig. A.1
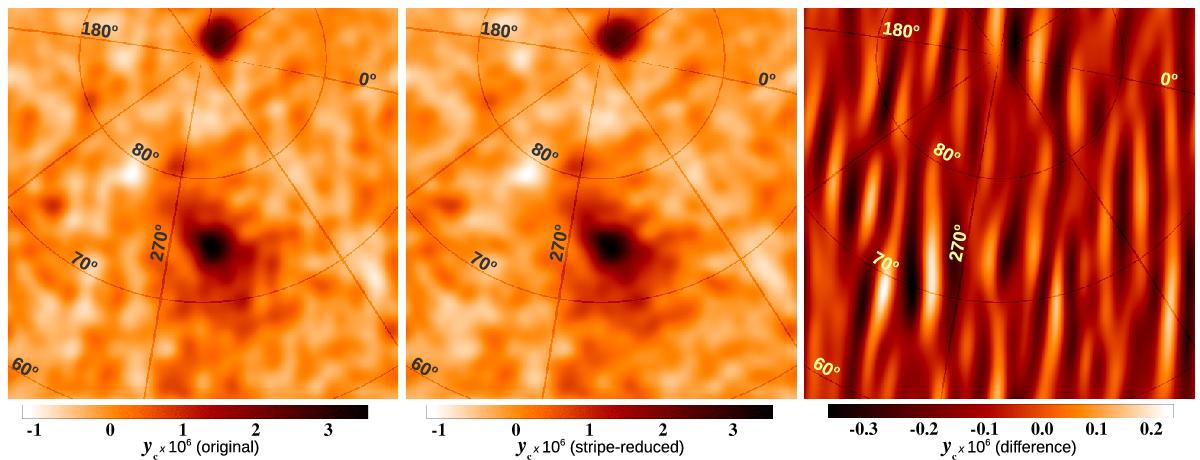
Estimation of the residual stripes in the SZ map in the Virgo region. All maps have been degraded to a resolution of ![]() . Left: original data. Middle: stripe-reduced data. Right: difference between the original and the stripe-reduced maps. The colour bar in the right panel shows the difference in units of 107 times the Compton parameter; the colour scale in the other panels is the same as in Fig. 5.
. Left: original data. Middle: stripe-reduced data. Right: difference between the original and the stripe-reduced maps. The colour bar in the right panel shows the difference in units of 107 times the Compton parameter; the colour scale in the other panels is the same as in Fig. 5.
Current usage metrics show cumulative count of Article Views (full-text article views including HTML views, PDF and ePub downloads, according to the available data) and Abstracts Views on Vision4Press platform.
Data correspond to usage on the plateform after 2015. The current usage metrics is available 48-96 hours after online publication and is updated daily on week days.
Initial download of the metrics may take a while.