Fig. 18
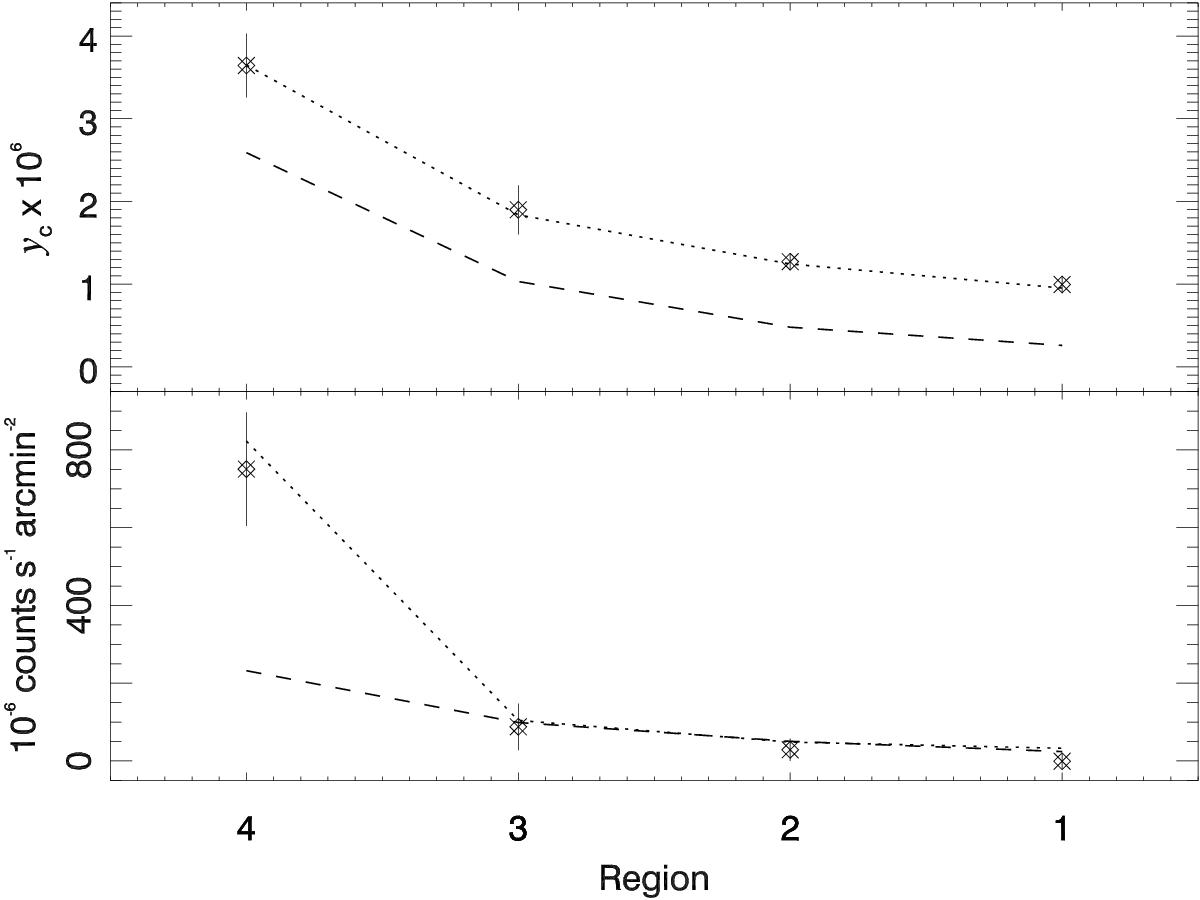
Mean signal (from the 15′ resolution maps) in each of the four regions shown in Fig. 16 (asterisks with error bars) compared with the predicted signal from analytical models. The models are shown in Fig. 17, as a dashed line for the spherical model and dotted line for the ellipsoidal model. The error bars are the dispersion in each region of the ![]() smoothed maps.
smoothed maps.
Current usage metrics show cumulative count of Article Views (full-text article views including HTML views, PDF and ePub downloads, according to the available data) and Abstracts Views on Vision4Press platform.
Data correspond to usage on the plateform after 2015. The current usage metrics is available 48-96 hours after online publication and is updated daily on week days.
Initial download of the metrics may take a while.