Fig. 15
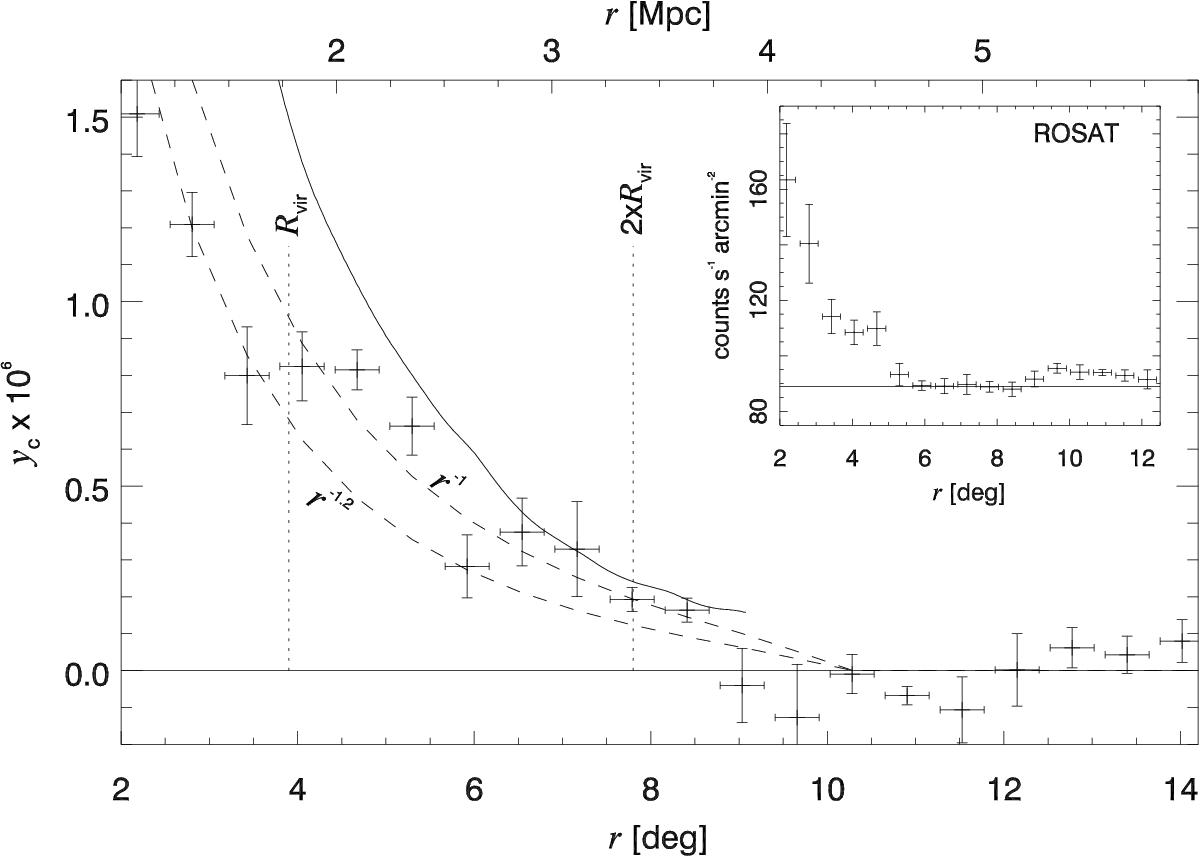
Binned radial yc profile of Virgo outskirts. The bins are 30 pixels wide (or equivalently 33′, or 230 kpc). The two dashed lines correspond to the expected signal from two analytical models where the electron density beyond 0.5 Mpc falls as r-1 or r-1.2. At r = 0.5 Mpc the model is normalized to the electron density given by G04 at that distance. At distances smaller than 0.5 Mpc the electron density follows the model of G04. The solid line shows the profile of the simulated Virgo cluster. The inset shows the corresponding profile in the ROSAT map using the same bins (with units the same as in Fig. 13).
Current usage metrics show cumulative count of Article Views (full-text article views including HTML views, PDF and ePub downloads, according to the available data) and Abstracts Views on Vision4Press platform.
Data correspond to usage on the plateform after 2015. The current usage metrics is available 48-96 hours after online publication and is updated daily on week days.
Initial download of the metrics may take a while.