Fig. 14
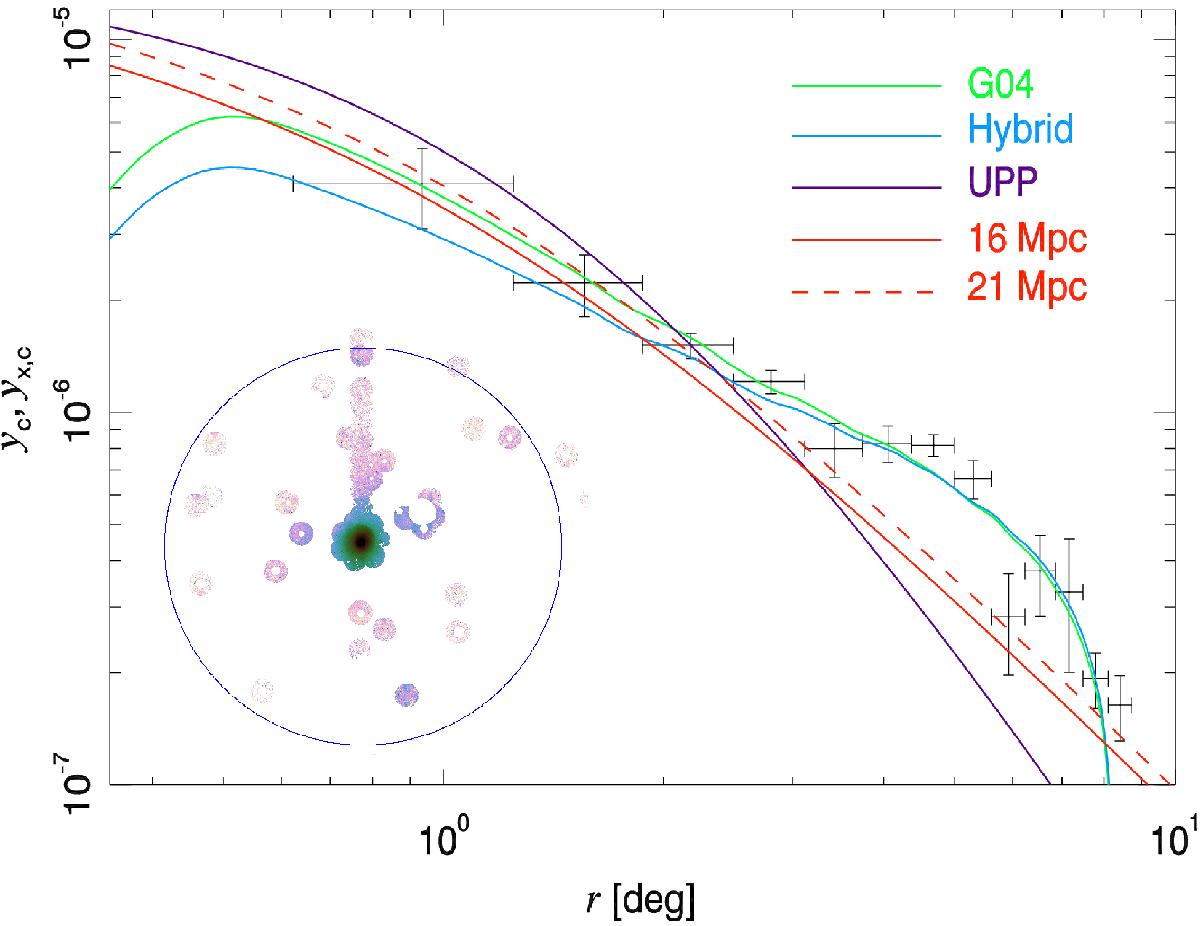
Binned pressure profiles derived for Virgo (black points with errors). The light-blue line shows the prediction from the hybrid model and the green line shows the prediction from the G04 model. Both models decrease at small radii due to the point source mask in Planck data, which is also applied to the simulated data (models). The dashed and solid red curves show the deprojected pressure from X-ray data assuming a universal shallow profile (with outer slope β = 3, see text) for a Virgo distance of 21 Mpc and 16 Mpc, respectively. As a comparison we show as a solid purple line the standard (steeper) Arnaud et al. (2010) profile (β = 4.13) for the case where the distance is set to 16 Mpc. The sparse sampling by XMM-Newton used to infer the deprojected pressure is shown in the bottom left with the circle marking the virial radius. The stripe with XMM-Newton pointings used in U11 is seen clearly in the vertical direction.
Current usage metrics show cumulative count of Article Views (full-text article views including HTML views, PDF and ePub downloads, according to the available data) and Abstracts Views on Vision4Press platform.
Data correspond to usage on the plateform after 2015. The current usage metrics is available 48-96 hours after online publication and is updated daily on week days.
Initial download of the metrics may take a while.