Free Access
Fig. 13
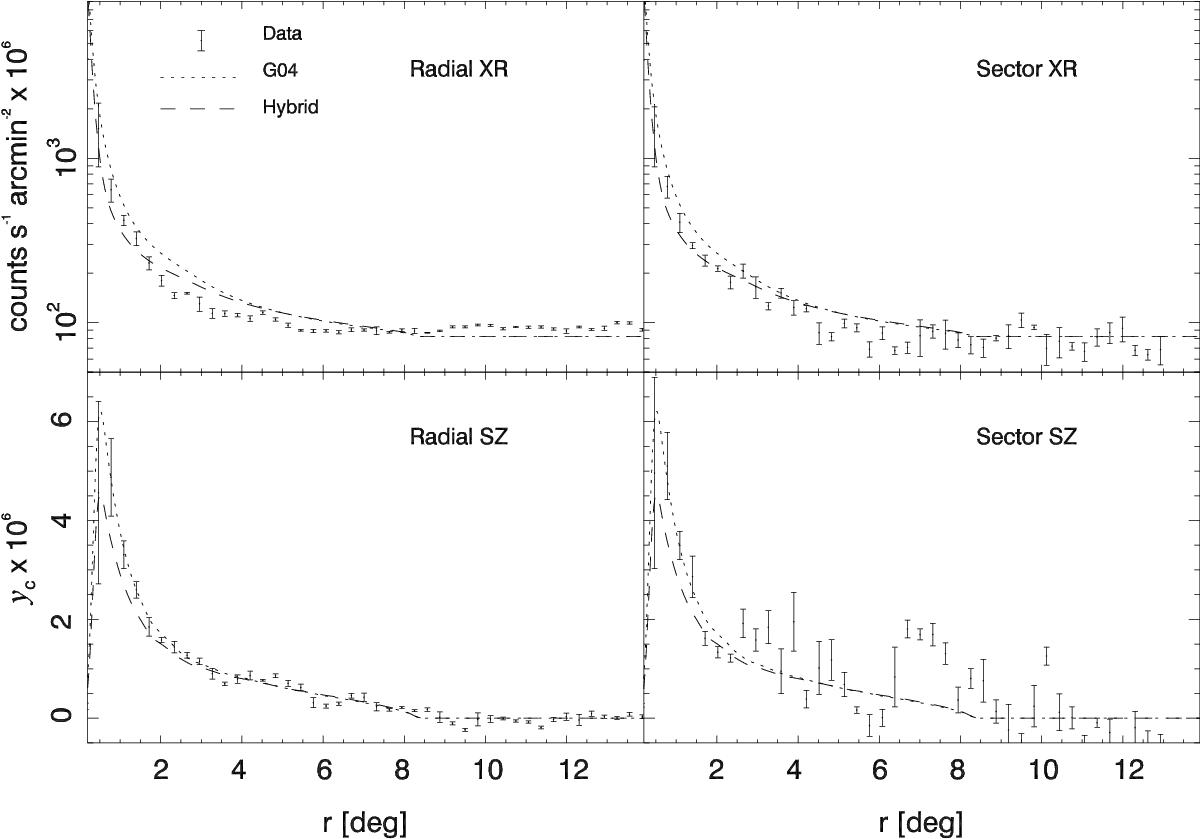
Planck SZ and ROSAT X-ray profiles compared with the G04 and hybrid models. The two plots on the left correspond to the radial profile and the two plots on the right correspond to the sector profile. For the sector profile, the SZ feature at 7deg is not masked in order to highlight its effect.
Current usage metrics show cumulative count of Article Views (full-text article views including HTML views, PDF and ePub downloads, according to the available data) and Abstracts Views on Vision4Press platform.
Data correspond to usage on the plateform after 2015. The current usage metrics is available 48-96 hours after online publication and is updated daily on week days.
Initial download of the metrics may take a while.