Fig. 12
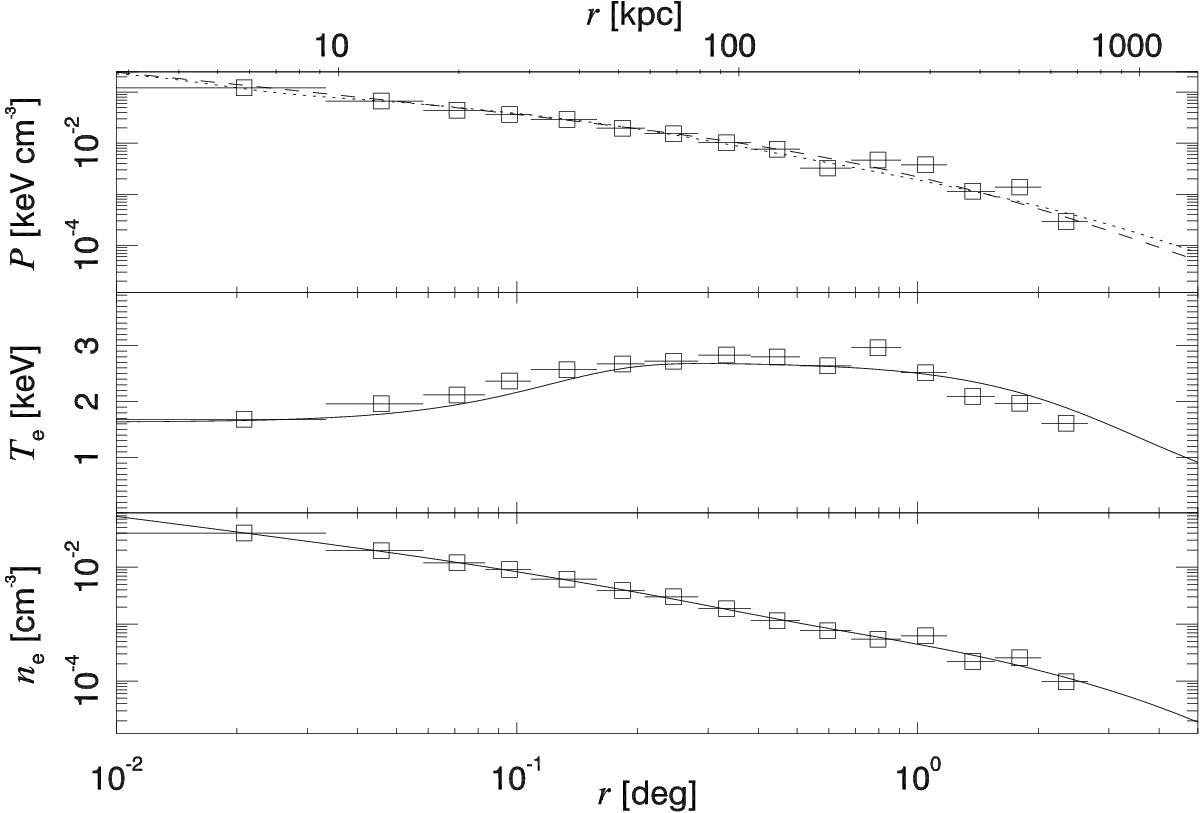
Deprojected pressure (top) and electron density profiles (bottom) from the sparse XMM-Newton data. The middle panel shows the projected temperature (see text). The pressure (top panel) is compared with an Arnaud et al. (2010) profile (dotted line), which fits the data well within the virial radius. The solid curves (dotted curve in the case of the pressure) represent a simple analytical model that fits the derived temperature and electron density. The pressure predicted from the deprojection analysis (dotted curve) is compared with the observations in Fig. 14.
Current usage metrics show cumulative count of Article Views (full-text article views including HTML views, PDF and ePub downloads, according to the available data) and Abstracts Views on Vision4Press platform.
Data correspond to usage on the plateform after 2015. The current usage metrics is available 48-96 hours after online publication and is updated daily on week days.
Initial download of the metrics may take a while.