Fig. 1
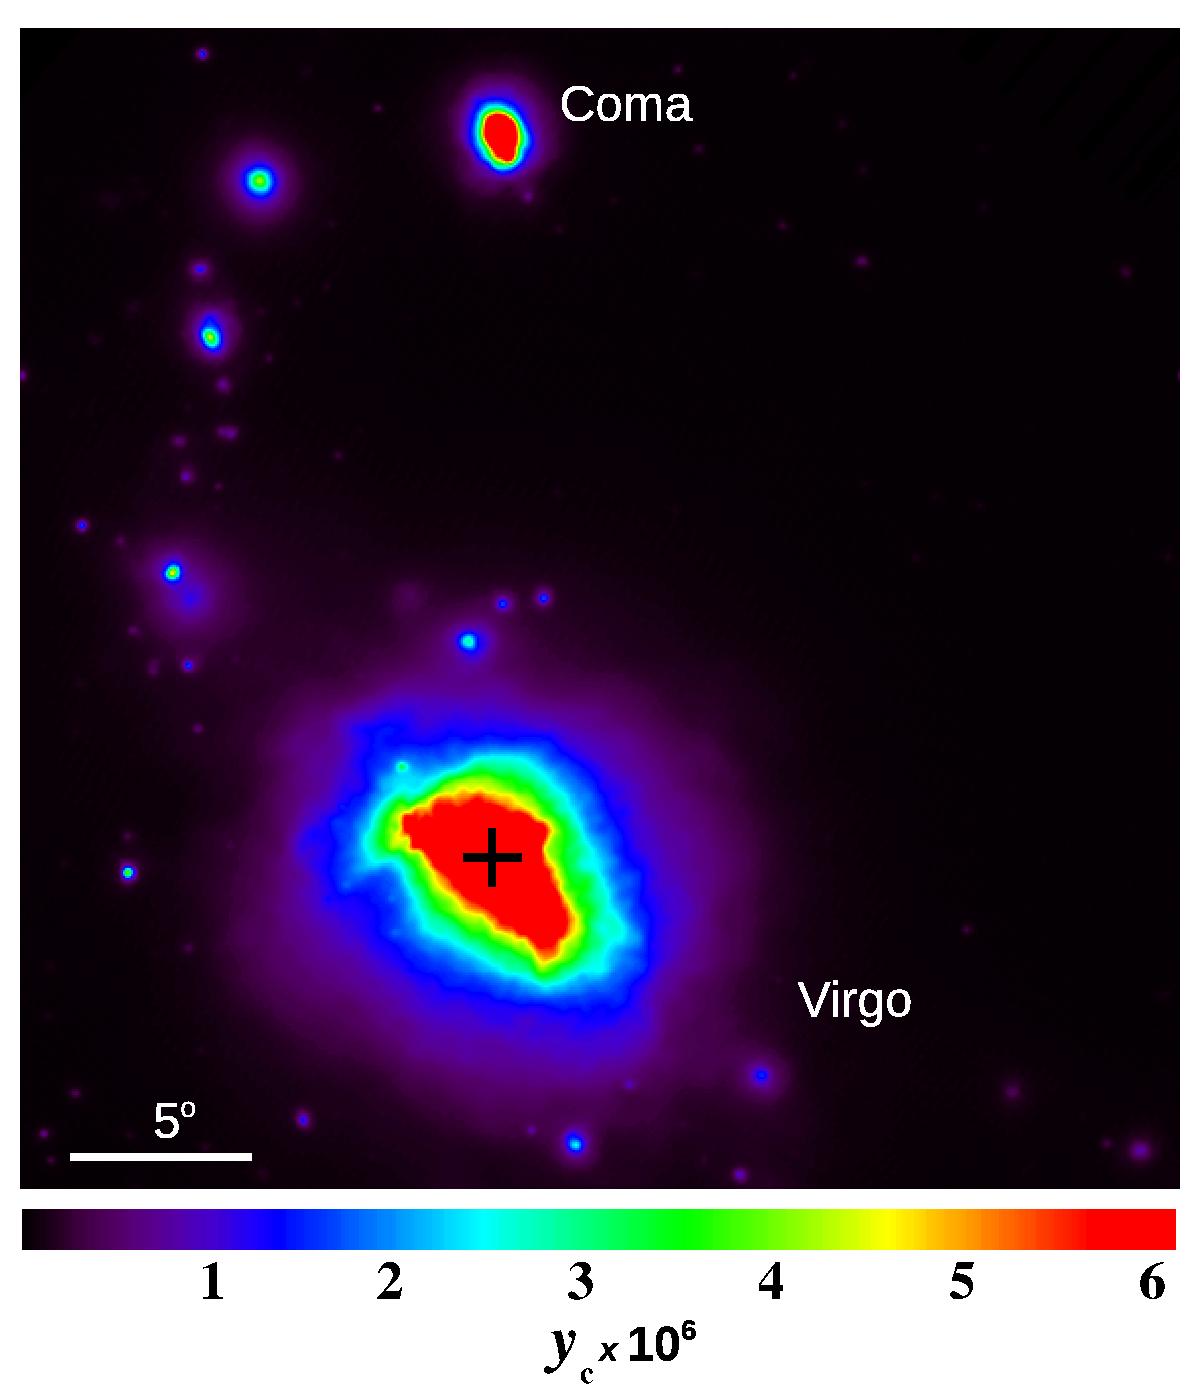
Simulated Virgo cluster (indicated by a black cross) from a constrained simulation in units of 10-6 times the Compton parameter (Dolag et al. 2005). To increase the contrast, the Compton parameter beyond 6 × 10⁻⁶ has been saturated. The brightest cluster in the top is Coma. In this and other figures (unless otherwise noted) the coordinates are Galactic, the projection is orthographic, and the field of view is 31.̊94 across or 8.3 (11.9) Mpc assuming Virgo is at a distance of 15 (21.4) Mpc. The North Galactic pole is up and Virgo’s centre (M 87) is 4° south of the centre of the images.
Current usage metrics show cumulative count of Article Views (full-text article views including HTML views, PDF and ePub downloads, according to the available data) and Abstracts Views on Vision4Press platform.
Data correspond to usage on the plateform after 2015. The current usage metrics is available 48-96 hours after online publication and is updated daily on week days.
Initial download of the metrics may take a while.