Fig. 4
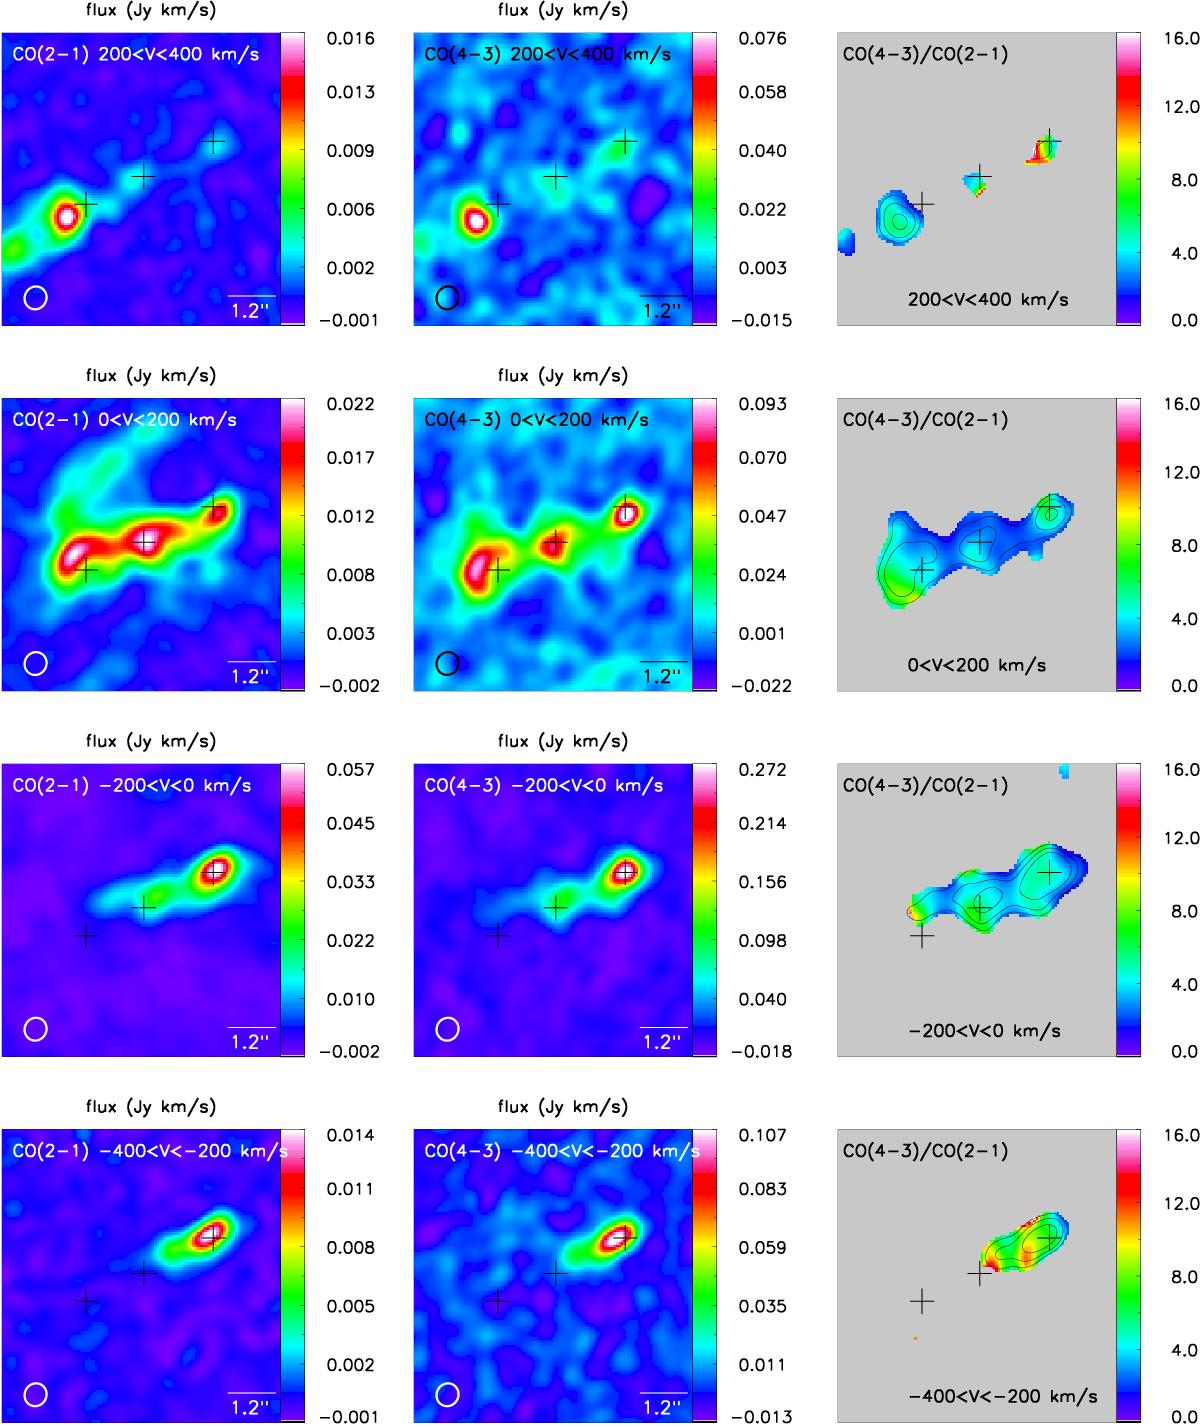
CO (4−3) and (2−1) images and F43/F21 ratio, integrated in 200 km s-1 bins. All panels were constructed directly from the data, and, unlike Fig. 3, they contain the disk emission. The image units, beam, FOV, and center are as in Fig. 3. Pixels with S/N< 3 have been masked. The contours in the last panel indicate where the CO(4 − 3) emission reaches S/N of 5, 10, and 20.
Current usage metrics show cumulative count of Article Views (full-text article views including HTML views, PDF and ePub downloads, according to the available data) and Abstracts Views on Vision4Press platform.
Data correspond to usage on the plateform after 2015. The current usage metrics is available 48-96 hours after online publication and is updated daily on week days.
Initial download of the metrics may take a while.