Fig. 3
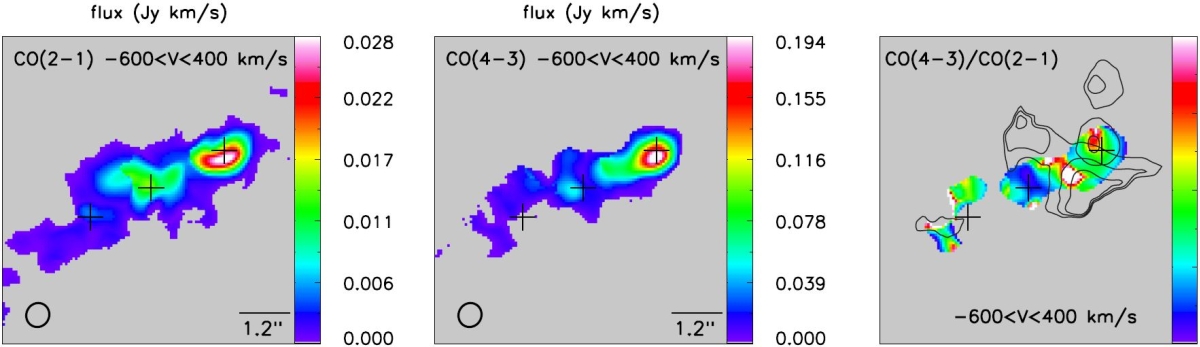
Left, middle: residual images from the subtraction of a disk model from the data (see Sect. 3). Their fluxes, integrated in the − 600 < V < 400 km s-1 range, are in units of Jy km s-1 per pixel. The common beam is 0.56′′× 0.53′′. Pixels with signal-to-noise (S/N) <5 have been masked. Right: F43/F21 of the residual images. Contours of the outflowing-to-ambient [Fe ii] emission from Dasyra et al. (2015) are overplotted, in steps of 0.2 starting from 0.1 for the fast winds near the lobes, and steps of 0.33 starting from 0.33 for the intermediate-velocity (component) of the other winds. The FOV and center are as in Fig. 1.
Current usage metrics show cumulative count of Article Views (full-text article views including HTML views, PDF and ePub downloads, according to the available data) and Abstracts Views on Vision4Press platform.
Data correspond to usage on the plateform after 2015. The current usage metrics is available 48-96 hours after online publication and is updated daily on week days.
Initial download of the metrics may take a while.