Fig. 1
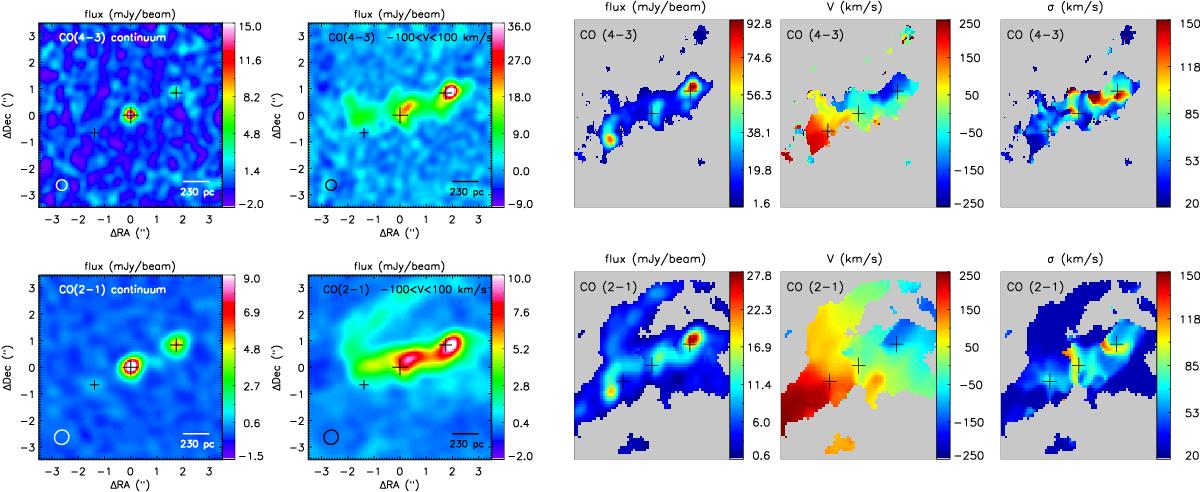
Left: images of CO (4−3), (2−1), and their nearby continua, extracted from the optimal-resolution cubes (i.e., 0.4′′× 0.4′′ beam in band 8 and 0.56′′× 0.53′′ beam in band 6). The line fluxes in mJy/beam were averaged over the −100 < V < 100 km s-1 range. Crosses indicate the locations of the nucleus and the two radio lobes, as seen in the CO(2 − 1) continuum (see Sect. 2 for the coordinates). Right: maps of the amplitude, velocity, and velocity dispersion of a Gaussian line-profile fit. All panels are centered at the nucleus, at 20:52:02.37 −57:04:07.6. They have a field of view (FOV) of 7′′× 7′′.
Current usage metrics show cumulative count of Article Views (full-text article views including HTML views, PDF and ePub downloads, according to the available data) and Abstracts Views on Vision4Press platform.
Data correspond to usage on the plateform after 2015. The current usage metrics is available 48-96 hours after online publication and is updated daily on week days.
Initial download of the metrics may take a while.