Fig. 7
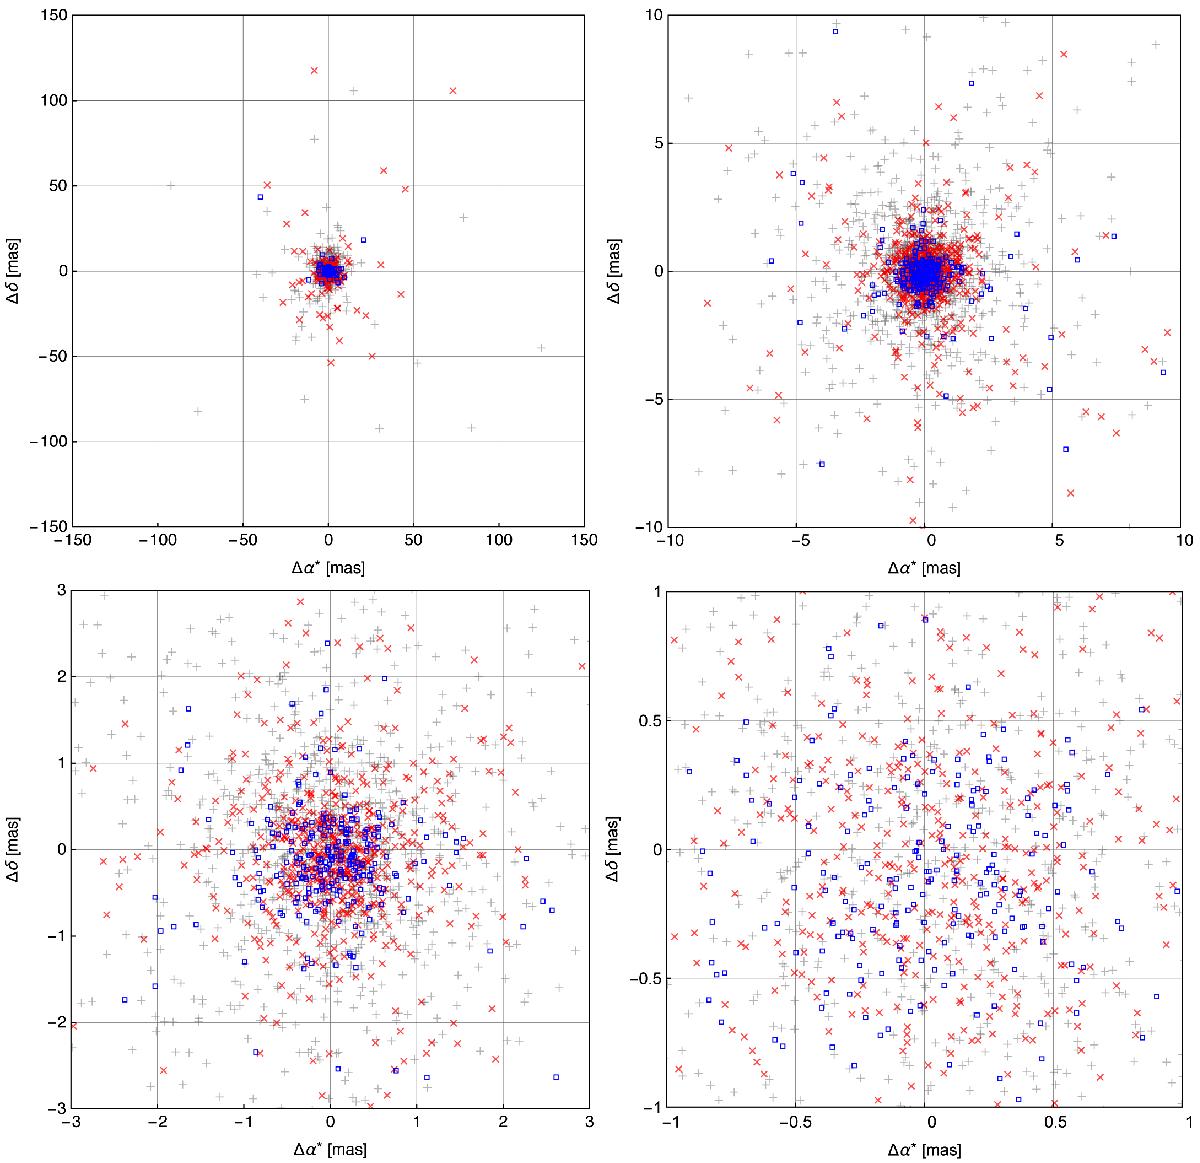
Scatter plot of position differences in right ascension and declination (Gaia minus ICRF2). Top left: all 2191 sources. Top right: the 2069 sources within ± 10 mas in both coordinates. Bottom left: the 1742 sources within ± 3 mas in both coordinates. Bottom right: the 1069 sources within ± 1 mas in both coordinates. Symbols show defining sources as blue squares, non-VCS sources as red crosses, and VCS-only sources as grey plus signs.
Current usage metrics show cumulative count of Article Views (full-text article views including HTML views, PDF and ePub downloads, according to the available data) and Abstracts Views on Vision4Press platform.
Data correspond to usage on the plateform after 2015. The current usage metrics is available 48-96 hours after online publication and is updated daily on week days.
Initial download of the metrics may take a while.