Free Access
Fig. 6
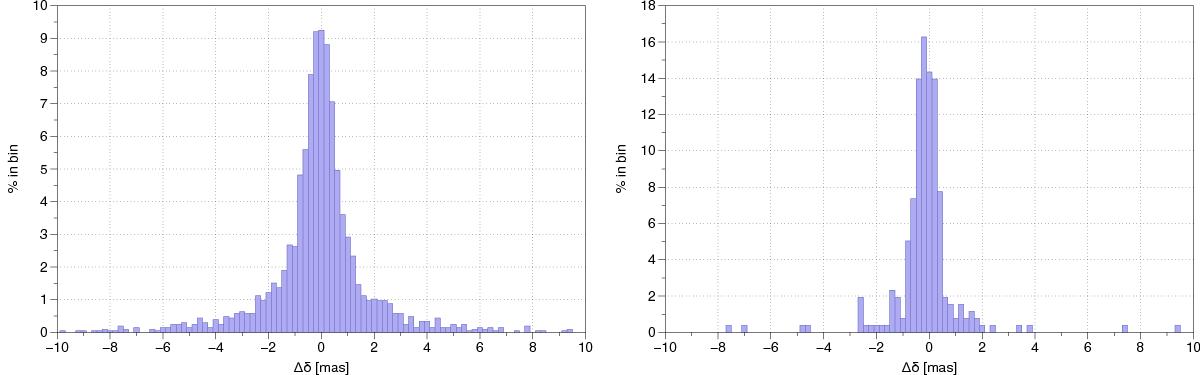
Distribution of the differences in declination between the Gaia solution and the ICRF2 positions. Left: the 2054 solutions closer than 10 mas to their radio position. Right: same for the 258 defining sources.
This figure is made of several images, please see below:
Current usage metrics show cumulative count of Article Views (full-text article views including HTML views, PDF and ePub downloads, according to the available data) and Abstracts Views on Vision4Press platform.
Data correspond to usage on the plateform after 2015. The current usage metrics is available 48-96 hours after online publication and is updated daily on week days.
Initial download of the metrics may take a while.