Fig. 10
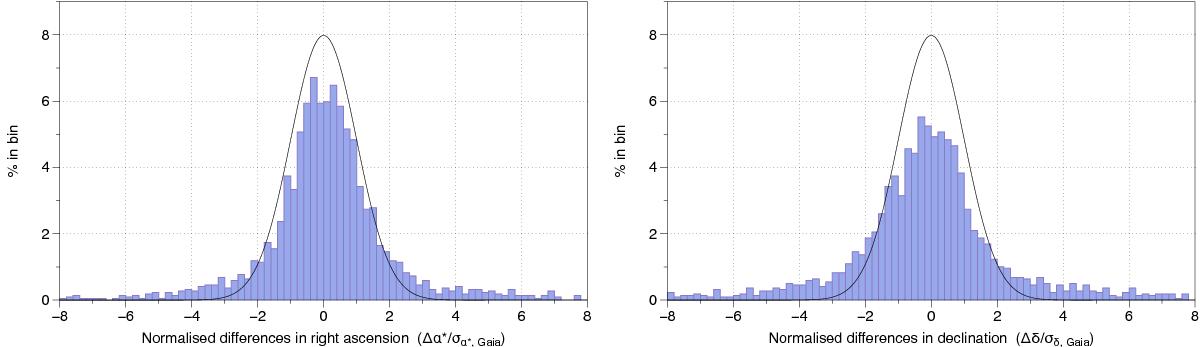
Distribution of the differences in right ascension (left) and declination (right) between the Gaia DR1 positions of 2191 ICRF sources, normalised by the uncertainties of the Gaia data. The histograms leave out 97 sources with | Δα ∗ /σα ∗ | > 8 and 154 sources with | Δδ/σδ | > 8. The black curves are the expected centred normal distribution of unit standard deviation.
Current usage metrics show cumulative count of Article Views (full-text article views including HTML views, PDF and ePub downloads, according to the available data) and Abstracts Views on Vision4Press platform.
Data correspond to usage on the plateform after 2015. The current usage metrics is available 48-96 hours after online publication and is updated daily on week days.
Initial download of the metrics may take a while.