Fig. 8
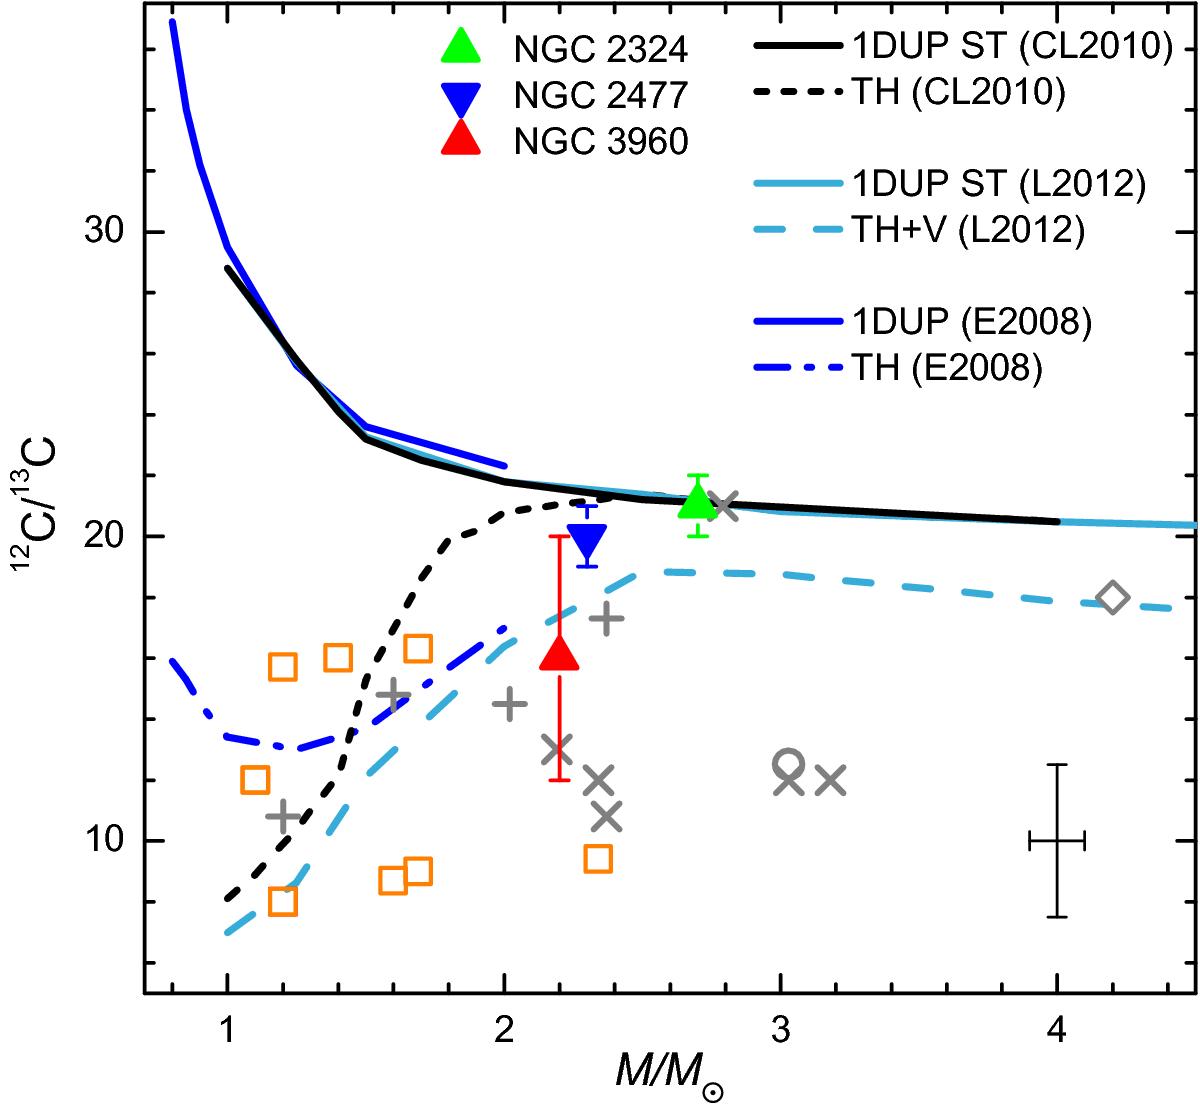
Average 12C/13C ratios in clump stars of open clusters as a function of stellar turn-off mass. Our work is represented by coloured triangles and bars indicating a star-to-star scatter. Open squares are for determinations by Drazdauskas et al. (2016), Mikolaitis et al. (2010, 2011a,b, 2012), and Tautvaišienė et al. (2000, 2005), crosses for Smiljanic et al. (2009), a diamond for Santrich et al. (2013), a circle is for Luck (1994), and plus signs for Gilroy (1989). The solid lines represent standard dredge-up models (Eggleton et al. 2008; Charbonnel & Lagarde 2010; Lagarde et al. 2012), the dash-dotted line represents the thermohaline mixing model by Eggleton et al. (2008), the short-dashed line is for a model including thermohaline mixing Charbonnel & Lagarde (2010), and the long-dashed line represents a model that includes both the thermohaline and rotational effects (Lagarde et al. 2012). A typical error bar is indicated (Smiljanic et al. 2009; Gilroy 1989).
Current usage metrics show cumulative count of Article Views (full-text article views including HTML views, PDF and ePub downloads, according to the available data) and Abstracts Views on Vision4Press platform.
Data correspond to usage on the plateform after 2015. The current usage metrics is available 48-96 hours after online publication and is updated daily on week days.
Initial download of the metrics may take a while.