Free Access
Fig. 3
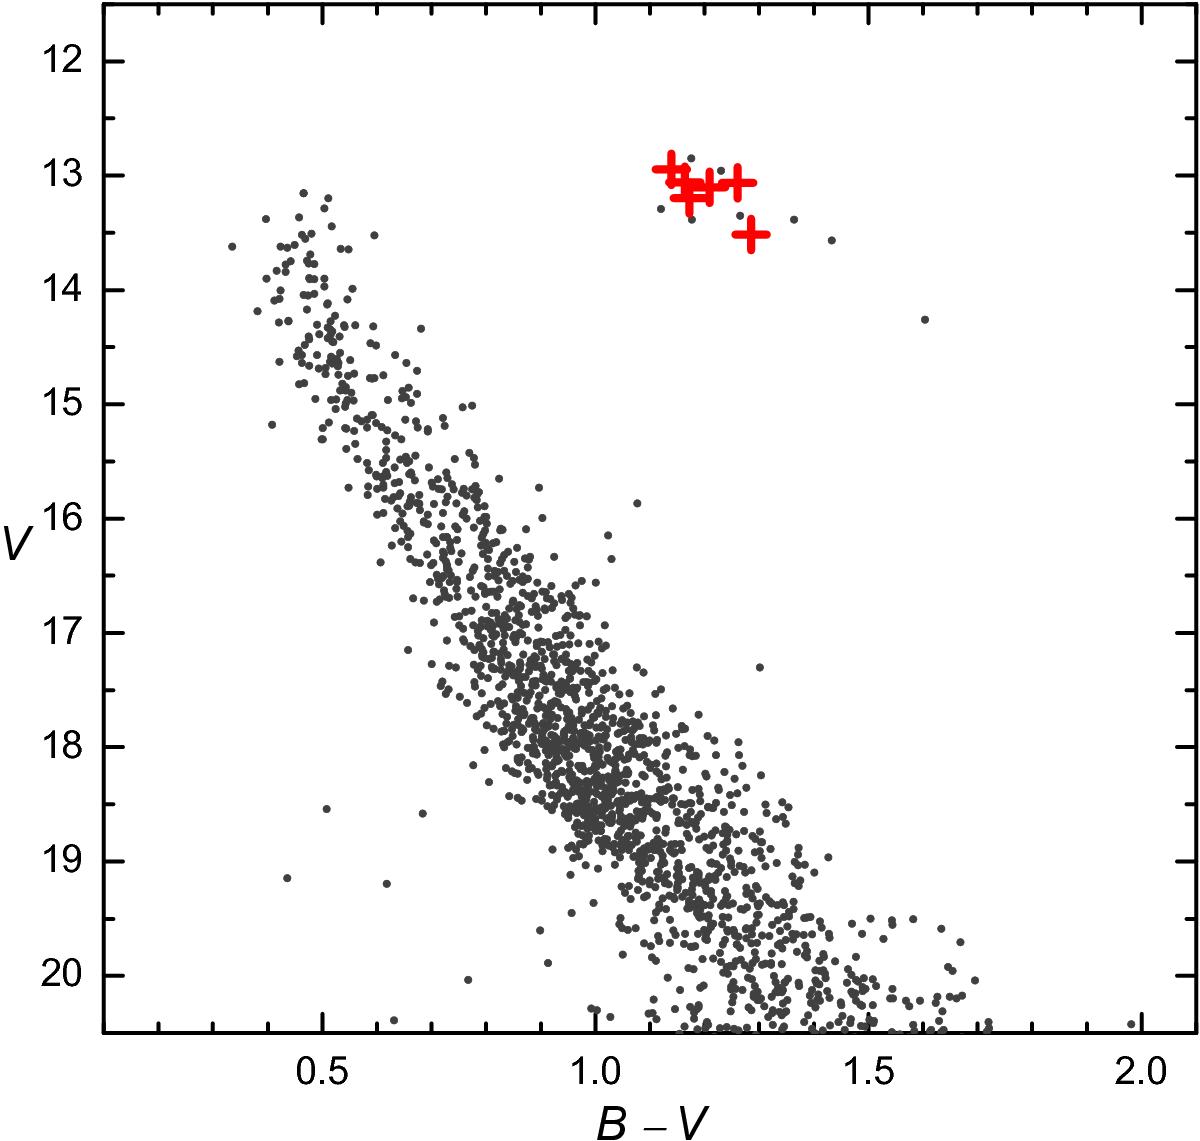
Colour–magnitude diagram of the open cluster NGC 3960. The stars investigated in this work are indicated by crosses. The diagram is based on BV photometry by Bragaglia et al. (2006).
Current usage metrics show cumulative count of Article Views (full-text article views including HTML views, PDF and ePub downloads, according to the available data) and Abstracts Views on Vision4Press platform.
Data correspond to usage on the plateform after 2015. The current usage metrics is available 48-96 hours after online publication and is updated daily on week days.
Initial download of the metrics may take a while.