| Issue |
A&A
Volume 595, November 2016
|
|
|---|---|---|
| Article Number | A103 | |
| Number of page(s) | 6 | |
| Section | Astrophysical processes | |
| DOI | https://doi.org/10.1051/0004-6361/201629236 | |
| Published online | 08 November 2016 | |
Optical and near-infrared photometric monitoring of the transient X-ray binary A0538−66 with REM
1 Institut für Astronomie und Astrophysik, Kepler Center for Astro and Particle Physics, Eberhard Karls Universität, Sand 1, 72076 Tübingen, Germany
e-mail: This email address is being protected from spambots. You need JavaScript enabled to view it.
2 ISDC Data Center for Astrophysics, Université de Genève, 16 chemin d’Écogia, 1290 Versoix, Switzerland
3 INAF–Osservatorio Astronomico di Brera, via Bianchi 46, 23807 Merate (LC), Italy
4 INAF–Istituto di Astrofisica Spaziale e Fisica Cosmica, via E. Bassini 15, 20133 Milano, Italy
5 Dr. Karl Remeis-Sternwarte and ECAP, Universität Erlangen-Nürnberg, Sternwartstrasse 7, 96049 Bamberg, Germany
Received: 4 July 2016
Accepted: 4 October 2016
Abstract
The transient Be/X-ray binary A0538−66 shows peculiar X-ray and optical variability. Despite numerous studies, the intrinsic properties underlying its anomalous behaviour remain poorly understood. Since September 2014 we have conducted the first quasi-simultaneous, optical and near-infrared photometric monitoring of A0538−66 in seven filters with the Rapid Eye Mount (REM) telescope to understand the properties of this binary system. We found that the REM light curves show fast flares lasting one or two days that repeat almost regularly every ~16.6 d, which is the orbital period of the neutron star. If the optical flares are powered by X-ray outbursts through photon reprocessing, the REM light curves indicate that A0538−66 is still active in X-rays; bright X-ray flares (Lx ≳ 1037 erg s-1) could be observable during the periastron passages. The REM light curves show a long-term variability that is especially pronounced in the g-band and decreases with increasing wavelength until it no longer appears in the near-infrared light curves. In addition, A0538−66 is fainter with respect to previous optical observations, and this is likely because of the higher absorption of the stellar radiation of a denser circumstellar disc. On the basis of the current models, we interpret these observational results with a circumstellar disc around the Be star observed nearly edge-on during a partial depletion phase. The REM light curves also show short-term variability on timescales of ~1 day, which is possibly indicative of perturbations in the density distribution of the circumstellar disc caused by the tidal interaction with the neutron star.
Key words: accretion, accretion disks / X-rays: binaries / (stars:) pulsars: individual: A0538-66
© ESO, 2016
1. Introduction
1A 0538−66 (hereafter A0538−66) is a Be/X-ray transient in the Large Magellanic Cloud. It hosts a neutron star (NS) with a pulse period of 69 ms (Skinner et al. 1982) and an orbital period of ~16.6 d (Johnston et al. 1979). A0538−66 was discovered in 1977 by the Ariel V satellite (White & Carpenter 1978) during an outburst with peak X-ray luminosity of 8.5 × 1038 erg s-1, exceeding the Eddington limit for a NS. Other outbursts with similar luminosity were observed with the HEAO 1 (Skinner et al. 1980) and Einstein satellites (Ponman et al. 1984; Skinner et al. 1982). The X-ray outbursts of A0538−66 display a wide range of durations from a few hours to ~14 d. The pulsations from the NS were discovered during a super-Eddington outburst (Lx = 8 × 1038 erg s-1) observed by the Einstein satellite. This is the only measurement of the pulse period of A0538−66. ROSAT, BeppoSAX, ASCA, and XMM-Newton observed A0538−66 at lower luminosities (Lx ≈ 5 × 1033−1037 erg s-1; Campana et al. 1995, 2002; Campana 1997; Corbet et al. 1997; Kretschmar et al. 2004).
A0538−66 also shows peculiar properties in the optical band. Skinner (1980) discovered bright and recurrent optical flares (luminosity up to ≈3 × 1038 erg s-1; Charles et al. 1983, hereafter C83) with period of ~16.7 d in phase with X-ray outbursts. To our knowledge, this is the only high-mass X-ray binary that shows fast optical flares associated with X-ray activity and brighter than the donor star. Contrary to low-mass X-ray binaries, where reprocessing of X-rays into optical/UV photons dominates or is comparable with the optical emission of the relatively faint donor star, most of the optical emission of Be/X-ray binaries is expected to come from the bright massive donor star and its circumstellar disc (e.g. van Paradijs 1998). Therefore, the optical flares of A0538−66 represent peculiar events in the class of Be/X-ray binaries.
The strong and complex spectroscopic and photometric variability of A0538−66 (see McGowan & Charles 2003, for a comprehensive summary) led to some confusion in determining the spectral type of the donor star. It has been classified as a B7e II (Murdin et al. 1981), OBe (Pakull & Parmar 1981), B2 III-IV (C83), B1 III (Hutchings et al. 1985), and B0.5 III (Negueruela & Coe 2002). The spectral type evolves to B8-9 I during bright optical outbursts (C83).
Several models were proposed to explain the X-ray and optical properties of A0538−66. In the model proposed by C83 (see also Densham et al. 1983; Smale et al. 1984), the NS has a highly eccentric orbit (e ≥ 0.7) around a B star. At the periastron passage, a fraction of the material lost by the primary filling its Roche lobe is accreted by the NS, which goes into X-ray outburst. The fraction of the material lost by the donor that is not accreted by the NS forms a large (R ≈ 45 R⊙ from UV spectroscopic observations, C83) and short-lived envelope around the donor star. In this scenario, the optical flares are powered by the reprocessing of the X-rays in this large envelope, whose mass and size exceed those of an ordinary Be envelope (Maraschi et al. 1983). The periods of inactivity (when no X-ray outbursts and optical flares are seen) could be a consequence of the slight shrinkage of the donor star and consequent Roche lobe underfilling. This is expected to be caused by temporary variations of the thermal equilibrium of the star due to the periodic forcing of mass transfer from the outer layers of the donor star to the NS. Stevens (1988a,b) developed an enhanced stellar wind accretion model for A0538−66 in which the gravitational distortion of the surface of the donor star, caused by the periastron passage of the NS in a high eccentric orbit, leads to an enhancement of the mass-loss rate of the donor star in the direction of the NS and consequently to much brighter X-ray outbursts than predicted by the standard spherically symmetric stellar winds.
The high dynamical range, spanning up to five orders of magnitude, and the absence of pulsations during the outbursts with luminosity Lx ≤ 1038 erg s-1, were explained by Campana et al. (1995) with the source going from direct accretion to the propeller state. The change of the accretion regime depends on the amount of inflowing matter and on the magnetic field of the NS. Campana et al. (1995, 2002) found that the required magnetic field would be B ≤ 2 × 10¹¹ G.
Another scenario was proposed by McGowan & Charles (2003) and Alcock et al. (2001; MC03; and A01, hereafter) on the basis of a fortuitous ~5 yr monitoring of A0538−66 by the Massive Compact Halo Objects (MACHO) project (from 1993 January 14 to 1998 May 28) and the archival UK Schmidt and Harvard photographic B-band plates taken between 1915 and 1981. The optical light curve showed a high variability with V magnitude ranging from ~15 to ~13 and with the brightest optical states corresponding to X-ray outbursts. The monitoring also revealed a long-term modulation at Plong = 420.8 ± 0.8 d (with a reddening at low fluxes) and a short-term modulation at Pshort = 16.6510 ± 0.0022 d. The latter confirmed the previously found orbital period. The orbital modulation was only seen at certain phases of the 421 d cycle, suggesting that the long-term modulation was related to variations in the Be star envelope. MC03 defined two states:
-
1.
Quiescent: times when the B star appears brighter (V ~ 14.4) and its optical emission is stable (i.e. no flares are seen). The quiescent state occurs typically in the phase range −0.06 ≲ φ ≲ 0.36 of the 421 d cycle (see top panel of Fig. 8 of MC03).
-
2.
Active: times when the source can be either in a low or in a high state:
-
low, times when the source is faint(V ~ 14.8) and no flares are seen;
-
high, optical/X-ray flares (V magnitude up to 12.7; e.g. C83), with recurrence time of ~16.6 d. These flares are constrained in the 421 d phase to occur during the active state alone.
-
The MC03 and A01 studies suggested that the rise and decay of brightness of the source (from active to quiescent state and back again) is caused by the depletion and formation of a circumstellar disc on the equatorial plane of the Be star, observed approximately edge-on. The reddening at low fluxes shown by A0538−66 is in agreement with the formation of a circumstellar disc. As the NS passes through the circumstellar disc, it accretes material that leads to X-ray and optical outbursts. This scenario is consistent with the presence of Balmer emission lines during the active state that indicate the presence of a circumstellar disc. During the quiescent state the spectrum does not show any Balmer emission, suggesting the absence of the circumstellar disc. During this state, only the naked B star is presumably observed.
Recently, Schmidtke et al. (2014b,a) studied the long-term variability of A0538−66, from 2010 to 2014, using the photometric I-band data of the Optical Gravitational Lensing Experiment IV (OGLE-IV) project. They found that the source is variable in the range I ~ 15.3−15.5. The 421 d cycle observed by MC03 and A01 disappeared and long-term variations seem to occur on irregular timescales. Schmidtke et al. (2014b,a) searched for periodicities linking eight bright OGLE-IV flares with four flares observed by Densham et al. (1983) and obtained the ephemeris P = 16.6429 ± 0.0007 d, T0 = 2 445 674.3 ± 0.2 JD.
Previous photometric optical monitoring of A0538−66 was based on a limited number of bands. However, a monitoring of this source in different wavelengths would allow us to gain new information about the properties of the short-term variability, such as the fast flares that were observed at periastron, and the long-term variability, which would help to improve our understanding of the physical processes responsible for the peculiar properties of A0538−66. Therefore, in September 2014 we started the first daily monitoring of this source based on quasi-simultaneous observations in seven bands with the Rapid Eye Mount (REM) telescope. The observations and data analysis method are described in Sect. 2. The results are reported in Sect. 3 and are discussed in Sect. 4.
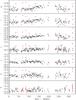 |
Fig. 1 Light curves g, r, i, z, J, H, K of A0538−66 observed with REM from Tstart = 56 903.2 MJD (3 September 2014). Red points are the flares lasting one or two days that repeat almost regularly every ~16.6 d. Errors are indicated at the 68% confidence level. |
2. Observations and data analysis
We analysed data collected with the REM telescope (Covino et al. 2004; Zerbi et al. 2004). REM is a fully automatic, fast reacting telescope at the ESO La Silla Observatory (Chile), whose main aim is to promptly catch the afterglows of gamma-ray bursts discovered by X-ray telescopes.
REM has a Ritchey-Chretien configuration with a 60 cm primary mirror and a total f/ 8 focal ratio and hosts the REMIR infrared camera (Conconi et al. 2004) and the ROSS2 optical camera (Tosti et al. 2004). The two cameras observe the same field of view of 10 × 10 arcmin almost simultaneously. The REMIR camera has a rotating wheel that accommodates three filters, J, H, K. The ROSS2 camera allows simultaneous imaging in the Sloan/SDSS g, r, i, z filters thanks to a band splitting obtained with plate dichroics. Therefore, REM enables the observation of a target in five bands simultaneously: one in the near-infrared band and four in optical bands.
We monitored A0538−66 for 257 nights (hereafter observations), from 3 September 2014 to 20 July 2015 (time span ~320 d). Each observation consists of five images (30 s integration time each) for each g, r, i, z, J, H, filter. To avoid saturation problems, the observations in the K filter consist of 15 images of 15 s integration time each. Two sets of optical images were obtained during the J and H observations, while the other three sets were captured during the K observations. For each night of observations, all the images were obtained within few minutes, hence, for the aims of this work we can assume that the observations were quasi-simultaneous.
We performed the data analysis using the Swift Reduction Package (SRP)1. We removed, by visual inspection, images affected by high background, bright pixels close to the target and the reference stars. The images were flat-field and bias corrected, and the magnitudes of the observed stars were obtained using the aperture photometry method. We performed flux calibration using reference stars in the field of view with g, r, i, z magnitudes from Zacharias et al. (2012) and J, H, K magnitudes from the 2MASS catalogue (Cutri et al. 2003).
For each observation and filter, the magnitude was calculated as the weighted mean of the magnitudes of each image. For filter K we had up to 15 images per observation. We grouped them in three sets of 5 images each to obtain three weighted mean magnitudes per night.
3. Results
A0538−66 shows a high variability on short (~1 d) and long (several days) timescales with amplitudes up to ~1 mag in the optical (g, r, i, z) and near-infrared (J, H, K) REM light curves (Fig. 1). Nine flares are clearly distinguishable in the g-band. Since the observations in the seven bands were quasi-simultaneous, the corresponding measurements are indicated in red in all panels. These flares last one or two days and repeat almost regularly every ~16.6 d (the orbital period of the NS) or a multiple of it. A few exceptions are the K-band, where only the last flare is easily distinguishable by eye, and the sixth and seventh flares, which are clearly observed only in the g and r-bands.
Using the ephemeris of the orbital period provided by Schmidtke et al. (2014b), we found that the REM flares fall in the orbital phase range of 0.96−0.15, in agreement with the findings of Schmidtke et al. (2014b,a). Figure 2 shows the REM light curves of A0538−66 folded at the orbital period value found by Schmidtke et al. (2014b). The high scattering of the points in the first panel is caused by the long-term variability which strongly affects this band (see below). To emphasise the orbital modulation in the g-band, we plotted the detrended g light curve obtained from a fifth order polynomial fitted to the g data without flares and then subtracted from the light curve (second panel, from top, of Fig. 2).
Flare 6 does not fall in the same phase range of the other flares (φ6th = 0.96 ± 0.03; see Fig. 2) and it occurs during a period in which the source was observed sporadically; there are only two other points before the flare, then the monitoring was interrupted for ~30 d (see Fig. 1). Since it might not be a real flare, hereafter we consider this flare separately.
Flares are associated with the periastron passage of the NS (Sect. 1), therefore they should occur every ≈16.6 d. We found that in five occasions A0538−66 was not observed during the interval in which the flare was expected. In other occasions the source was covered by the monitoring but it showed a low luminosity without any evidence of flaring activity (see Fig. 2). The occurrence rate of flares during the REM monitoring is thus ≈50%.
Black points of g, r, i, light curves (Fig. 1) show a possible long-term variability characterised by an increase of the flux from t ~ 120 d to t ~ 150 d and a decrease from t ~ 240 d to t ~ 280 d. We used the Spearman Rank correlation test for the presence of such trend in the light curves (excluding flares). For the g-light curve, we find a probability of no correlation of Pg ≃ 0.2%, while for the other bands there is no evidence for long-term variability (Pr ≃ 11%, Pi ≃ 9%; probabilities in the range 9% to 95% for the other bands). A similar trend has been observed by Schmidtke et al. (2014b,a) with OGLE.
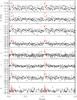 |
Fig. 2 REM light curves of A0538−66 folded at the orbital period of Schmidtke et al. (2014b). Errors are indicated at the 68% confidence level. Second panel (from top) shows the detrended g light curve obtained by subtracting the 5th order polynomial fitted to the g light curve (excluding flares). Red points correspond to the flares of Fig. 1. |
4. Discussion
In the previous section we presented new results about the long-term and short-term optical variability of A0538−66 obtained through the REM monitoring. In Sects. 4.1–4.3, we interpret these results on the basis of the models proposed so far for A0538−66 and for the dynamical evolution of circumstellar discs in Be stars.
4.1. Long-term variability
The temporal evolution of the g, r, i magnitudes in Fig. 1 is characterised by a low-luminosity state when t ≲ 120 d and t ≳ 240 d and a high-luminosity state when 150 ≲ t ≲ 240 d. The average g, r, i, magnitudes computed excluding the flares (i.e. obtained from black points of Fig. 1) during the low-luminosity state observed by REM are gll = 15.21 ± 0.08, rll = 15.55 ± 0.11, ill = 15.75 ± 0.10, while during the high-luminosity state they are ghl = 15.04 ± 0.07, rhl = 15.41 ± 0.12, ihl = 15.58 ± 0.09. We converted these magnitudes to Johnson V and Kron-Cousins R magnitudes using the transformation equations of Jester et al. (2005). We obtained Vll = 15.40 ± 0.16, Rll = 15.38 ± 0.20 and Vhl = 15.24 ± 0.16, Rhl = 15.20 ± 0.20. The magnitudes reported by A01 during the active-low state are Val ≈ 14.7−14.9, Ral ≈ 14.8−15, while during the quiescent state they are Vq ≈ 14.4, Rq ≈ 14.6−14.7. If we consider a systematic error of ±0.1 mag due to the zero-point uncertainty in MACHO photometry (Alcock et al. 1999) a comparison between REM and MACHO magnitudes reported above suggests that during the REM monitoring, A0538−66 was fainter than in the past. In particular, the magnitudes during the low-luminosity state observed by REM are larger than the MACHO magnitudes measured during the active-low luminosity state, while the magnitudes during the REM high-luminosity state are just slightly larger than those measured by MACHO during the active-low state. In addition to the zero-point uncertainty, another source of inaccuracy might lie in the conversion of magnitudes from the non-standard MACHO instrumental bandpasses to the Johnson-Kron-Cousins system (see Fig. 1 of Alcock et al. 1999).
The colour–magnitude diagram of A0538−66 (Fig. 3) shows that there is not a significant spectral variability between the flares (red points) and the other observations (black points). A comparison between the g−r versus g diagram (Fig. 3) and the V−R versus V diagram of A01 shows that the bright and bluer branch corresponding to the quiescent state is not present in the g−r versus g diagram of the REM observations. In the framework of the model of MC03 and A01, Fig. 3 suggests that a remnant of the circumstellar disc partially covering the Be star is present during the the high-luminosity state observed by REM, preventing to observe the naked star.
In principle, simultaneous photometric monitoring of Be stars at different wavelengths could allow us to infer the properties of the disc and estimate the inclination angle of the system (e.g. Carciofi et al. 2006). In fact, fluxes at different wavelengths carry information from different regions of the circumstellar disc. For instance, at short wavelengths (optical), most of the continuum radiation is formed in a relatively small region near the star (e.g. within about two stellar radii for V-band), whereas the emission at longer wavelengths (infrared) arises from a larger area of the disc (e.g. roughly up to ≈10 stellar radii for K-band). Therefore, temporal evolution of the disc density, including the build-up and depletion phases, as well as the mass injection properties (periodic or episodic mass injection) affect the photometric light curves of different filters differently (Poeckert & Marlborough 1978; Haubois et al. 2012, and references therein). In addition, the inclination angle of the circumstellar disc substantially modifies the observed fluxes at different wavelengths. Haubois et al. (2012) studied the dynamical evolution of circumstellar discs around Be stars through simulations based on a three-dimensional non-local thermal equilibrium radiative transfer code. They calculated the temporal evolution of photometric observables for different configurations of the system, such as mass-loss history, α viscosity parameter, and inclination angle of the disc. For several configurations of the system, they provided theoretical light curves at different wavelengths. We compared them with the REM light curves of A0538−66 and found a good agreement if we assume that the circumstellar disc of A0538−66 is observed edge-on. For this configuration of the system, the theoretical light curves at short wavelengths (Fig. 13 of Haubois et al. 2012; to be compared with g light curve of our observations) show that for inclination angles greater than 70°,2 the flux decreases during the build-up phase, reaches a plateau, and then increases during the depletion phase to the original value. In fact, the emission in the optical bands arises from the densest inner part of the disc and depends on the gas emission and the absorption of the stellar radiation in the circumstellar disc. Therefore, if the disc is observed edge-on, during the build-up phase the decrease of the flux caused by the increase of the absorption dominates over the brightening caused by the increase of the size and density of the disc. Similarly, during the depletion phase, the decrease of the absorption of the stellar radiation causes an increase of the flux that reaches its maximum when the disc disappears. If the inclination angle were i< 70°, the contribution to the optical emission from the disc would be dominant with respect to the absorption of the stellar radiation. Therefore, the flux would increase during the build-up phase and decrease during the depletion phase. The simulated light curves of Haubois et al. (2012) predict a balance between the emission gas and absorption of the stellar radiation when i = 70°, hence a constant flux at short wavelengths is expected in this case.
The infrared (IR) bands give information about the external part of the disc where the build up and depletion of the disc produces the highest density variations. Therefore, if a forming/dissipating disc is observed face-on, the IR light curves are subject to high variability. Figure 16 of Haubois et al. (2012) shows that if the disc is observed edge-on, emission and absorption balance each other and the observed flux does not vary significantly. The absence of a significant long-term variability in the J, H, K, light curves of the REM monitoring is thus in agreement with the edge-on scenario, and is consistent with the type of variability observed in the g-band. Based on the considerations presented at the beginning of this section, the circumstellar disc should be always present during the REM monitoring. Therefore, the observed long-term variability can be explained with a temporary and partial depletion of the disc, probably caused by the tidal interactions between the disc and the NS, which can lead in some cases to the truncation of the disc (e.g. Okazaki & Negueruela 2001; and Panoglou et al. 2016, for recent results about the disc truncation mechanism). Therefore, the maximum magnitude difference between the fully developed disc state and the naked star state must be calculated using the REM observations (V ≈ 15.4, converted from the g and r-bands using the transformation equations of Jester et al. 2005) and the photospheric flux measured by A01 (V ≈ 14.4) during the quiescent state. We found a value ΔV ≈ 1, which is much larger than the maximum predicted by Haubois et al. (2012) for i = 90°, ΔV ≈ 0.2. However, the theoretical computations of Haubois et al. (2012) have been performed for isolated Be stars. Tidal interaction between the circumstellar disc and a NS companion are expected to affect the density structure of the disc (Panoglou et al. 2016, and references therein), hence deviations from the results of Haubois et al. (2012) are expected.
4.2. Flares
On 29 April 1981, A0538−66 showed one of its brightest optical flares (V ~ 12.7). C83 used spectro-photometric observations of the flare, obtained with the International Ultraviolet Explorer (IUE), to estimate an effective temperature of Teff = 12 500 K, a radius of the emitting region of R = 45 R⊙, and an optical luminosity of Lopt = 3 × 1038 erg s-1, which is a factor ~6.4 brighter than in the active-low state (Lopt = 4.7 × 1037 erg s-1; C83). To compare the optical luminosity of the flare reported by C83 with those of the flares observed by REM, we fitted the spectral energy distribution (SED) of the latter with an absorbed blackbody model. For the extinctions, we used the approximations of Cardelli et al. (1989) assuming for the interstellar reddening in the direction of A0538−66 the value E(B−V) ≈ 0.143. A significant fraction of the radiation is expected to be emitted at UV wavelengths. Therefore, the SED obtained from the REM observations, which covers the optical/near-IR domain, can be used to obtain only a rough estimate of the optical luminosity during the flares. We found that the optical luminosity during the flares is 2 × 1037 ≲ Lopt ≲ 15 × 1037 erg s-1, on average 40% brighter than in the observations that preceded and followed the flares. The excess luminosity during the flares above the underlying emission from the star and circumstellar disc is thus  erg s-1. Therefore, the flares observed by REM are much fainter than the event of 1981. We noted that flare 6 is much brighter compared to the others:
  erg s-1. For the reasons mentioned in Sect. 3, the results of this flare should be taken with caution. In addition, light curves of Fig. 1 show that flare 7 has a different spectral shape compared to the others, as it is only distinguishable as a flare in the optical bands.
As mentioned in Sect. 1, A0538−66 has an anomalously large ratio  for an early-type binary system. Assuming the value
  reported by Maraschi et al. (1983), we found that the optical outbursts observed with REM were powered by reprocessed X-ray flares with luminosity Lx ≳ 2−13 × 1037 erg s-1. A0538−66 was not observed in X-ray during the optical flares detected by REM. Therefore, we cannot confirm the presence of X-ray flares simultaneous with the optical flares.
4.3. Short-term variability
In addition to the periodic flares associated with the orbital period of the NS, the REM light curves showed another type of short-term variability, on timescales of ~1 d. This irregular variability can be attributed to the perturbation in the density distribution of the circumstellar disc caused by the tidal interaction with the NS. Alternatively, this variability might be caused by non-radial pulsations that can produce variations up to 0.1 mag in visual bands (e.g. Percy et al. 1997; Kızıloǧlu et al. 2007, and references therein). Since this type of variability is not irregular, we searched for periodic signals on short timescales using the fast Lomb-Scargle periodogram technique for unevenly sampled time series (Lomb 1976; Scargle 1982). To avoid aliasing, we searched for signals with periods longer than the Nyquist limit of 2 d (i.e. half of the sampling frequency of 1 d-1). No statistically significant periodicities associated with the observed short-term variability were detected, thus disfavouring the “non-radial pulsations” hypothesis.
5. Conclusions
We presented the results obtained from the first daily photometric monitoring of A0538−66 performed quasi-simultaneously on seven bands, from optical to near-IR. The long-term variability observed by Schmidtke et al. (2014b) in OGLE light curves is clearly observed in the REM light curve in the g-band as well, while it is absent in the near-IR bands (Fig. 1). In REM observations, A0538−66 is fainter than in the previous MACHO observations (MC03; A01), probably because of the higher absorption of the stellar radiation by a denser circumstellar disc. We showed that the long-term variability observed in the REM light curves at different wavelengths is qualitatively in agreement with the theoretical light curves obtained by Haubois et al. (2012) for a circumstellar disc observed edge-on during a partial depletion phase of the disc. Therefore, the results obtained with the REM monitoring are consistent with the scenario proposed by MC03, and suggest that the inclination angle of the disc should be close to 90°, in agreement with the lower limit of ~75° obtained by MC03.
The REM observations allowed us to observe two types of short-term variability: fast flares (with durations of 1−2 d) that repeat almost regularly every ~16.6 d (the orbital period of the NS) and an irregular variability, which we interpret as due to perturbations in the density distribution of the circumstellar disc caused by the tidal interaction with the NS. If the optical flares are powered by X-ray outbursts through photon reprocessing (C83; Maraschi et al. 1983), the observed fast flares suggest that A0538−66 is active in X-ray. We made a rough estimate of the expected X-ray luminosity associated with the observed optical flares and we found that A0538−66 may have reached X-ray luminosities Lx ≳ 1037 erg s-1 during the REM monitoring. We noticed that flare 7 shows a different spectral shape compared to the other flares. Further simultaneous observations at different wavelengths, including X-rays and UV band, will be valuable to better characterise the complex observational properties shown by this peculiar binary system.
Haubois et al. (2012) reported theoretical light curves only for inclination angles i = 0° (face-on), i = 70°, and i = 90° (edge-on).
The assumed value for the interstellar reddening was extracted from the maps of Schlafly & Finkbeiner (2011) and Schlegel et al. (1998) available at: http://irsa.ipac.caltech.edu.
Acknowledgments
We thank the anonymous referee for constructive comments that helped to improve the paper. L.D. acknowledges Roberto Decarli for suggesting the use of REM, Dino Fugazza for the helpful advice during the preparation of the observational strategy, and Emilio Molinari for granting us the first six months observing time through DDT. This work is supported bythe Bundesministerium für Wirtschaft und Technologie through the Deutsches Zentrum für Luft und Raumfahrt (grant FKZ 50 OG 1602). M.S. acknowledges support by the Deutsche Forschungsgemeinschaft through the Heisenberg Fellowship SA 2131/3-1. V.D. acknowledges support from Deutsches Zentrum für Luft- und Raumfahrt (DLR) through DLR-PT grant 50 OR 0702. S.M. acknowledges financial contribution from PRIN INAF 2014 and from ASI/INAF Agreement I/037/12/0.
References
- Alcock, C., Allsman, R. A., Alves, D. R., et al. 1999, PASP, 111, 1539 [NASA ADS] [CrossRef] [Google Scholar]
- Alcock, C., Allsman, R. A., Alves, D. R., et al. 2001, MNRAS, 321, 678 [NASA ADS] [CrossRef] [Google Scholar]
- Campana, S. 1997, A&A, 320, 840 [NASA ADS] [Google Scholar]
- Campana, S., Stella, L., Mereghetti, S., & Colpi, M. 1995, A&A, 297, 385 [NASA ADS] [Google Scholar]
- Campana, S., Stella, L., Israel, G. L., et al. 2002, ApJ, 580, 389 [NASA ADS] [CrossRef] [Google Scholar]
- Cardelli, J. A., Clayton, G. C., & Mathis, J. S. 1989, ApJ, 345, 245 [NASA ADS] [CrossRef] [Google Scholar]
- Carciofi, A. C., Miroshnichenko, A. S., Kusakin, A. V., et al. 2006, ApJ, 652, 1617 [NASA ADS] [CrossRef] [Google Scholar]
- Charles, P. A., Booth, L., Densham, R. H., et al. 1983, MNRAS, 202, 657 [NASA ADS] [Google Scholar]
- Conconi, P., Cunniffe, R., D’Alessio, F., et al. 2004, in Ground-based Instrumentation for Astronomy, eds. A. F. M. Moorwood, & M. Iye, Proc. SPIE, 5492, 1602 [Google Scholar]
- Corbet, R. H. D., Charles, P. A., Southwell, K. A., & Smale, A. P. 1997, ApJ, 476, 833 [NASA ADS] [CrossRef] [Google Scholar]
- Covino, S., Stefanon, M., Sciuto, G., et al. 2004, in Ground-based Instrumentation for Astronomy, eds. A. F. M. Moorwood, & M. Iye, Proc. SPIE, 5492, 1613 [Google Scholar]
- Cutri, R. M., Skrutskie, M. F., van Dyk, S., et al. 2003, VizieR Online Data Catalog: II/246 [Google Scholar]
- Densham, R. H., Charles, P. A., Menzies, J. W., van der Klis, M., & van Paradijs, J. 1983, MNRAS, 205, 1117 [NASA ADS] [CrossRef] [Google Scholar]
- Haubois, X., Carciofi, A. C., Rivinius, T., Okazaki, A. T., & Bjorkman, J. E. 2012, ApJ, 756, 156 [NASA ADS] [CrossRef] [Google Scholar]
- Hutchings, J. B., Crampton, D., Cowley, A. P., et al. 1985, PASP, 97, 418 [NASA ADS] [CrossRef] [Google Scholar]
- Jester, S., Schneider, D. P., Richards, G. T., et al. 2005, AJ, 130, 873 [NASA ADS] [CrossRef] [Google Scholar]
- Johnston, M. D., Bradt, H. V., Doxsey, R. E., et al. 1979, ApJ, 230, L11 [NASA ADS] [CrossRef] [Google Scholar]
- Kızıloǧlu, U., Kızıloǧlu, N., Baykal, A., Yerli, S. K., & Özbey, M. 2007, A&A, 470, 1023 [NASA ADS] [CrossRef] [EDP Sciences] [Google Scholar]
- Kretschmar, P., Wilms, J., Staubert, R., Kreykenbohm, I., & Heindl, W. A. 2004, in 5th INTEGRAL Workshop on the INTEGRAL Universe, eds. V. Schoenfelder, G. Lichti, & C. Winkler, ESA SP, 552, 329 [Google Scholar]
- Lomb, N. R. 1976, Ap&SS, 39, 447 [NASA ADS] [CrossRef] [Google Scholar]
- Maraschi, L., Traversini, R., & Treves, A. 1983, MNRAS, 204, 1179 [NASA ADS] [CrossRef] [Google Scholar]
- McGowan, K. E., & Charles, P. A. 2003, MNRAS, 339, 748 [NASA ADS] [CrossRef] [Google Scholar]
- Murdin, P., Branduardi-Raymont, G., & Parmar, A. N. 1981, MNRAS, 196, 95P [NASA ADS] [CrossRef] [Google Scholar]
- Negueruela, I., & Coe, M. J. 2002, A&A, 385, 517 [NASA ADS] [CrossRef] [EDP Sciences] [Google Scholar]
- Okazaki, A. T., & Negueruela, I. 2001, A&A, 377, 161 [NASA ADS] [CrossRef] [EDP Sciences] [Google Scholar]
- Pakull, M., & Parmar, A. 1981, A&A, 102, L1 [NASA ADS] [Google Scholar]
- Panoglou, D., Carciofi, A. C., Vieira, R. G., et al. 2016, MNRAS, 461, 2616 [NASA ADS] [CrossRef] [Google Scholar]
- Percy, J. R., Harlow, J., Hayhoe, K. A. W., et al. 1997, PASP, 109, 1215 [NASA ADS] [CrossRef] [Google Scholar]
- Poeckert, R., & Marlborough, J. M. 1978, ApJS, 38, 229 [CrossRef] [Google Scholar]
- Ponman, T. J., Skinner, G. K., & Bedford, D. K. 1984, MNRAS, 207, 621 [NASA ADS] [Google Scholar]
- Scargle, J. D. 1982, ApJ, 263, 835 [NASA ADS] [CrossRef] [Google Scholar]
- Schlafly, E. F., & Finkbeiner, D. P. 2011, ApJ, 737, 103 [NASA ADS] [CrossRef] [Google Scholar]
- Schlegel, D. J., Finkbeiner, D. P., & Davis, M. 1998, ApJ, 500, 525 [NASA ADS] [CrossRef] [Google Scholar]
- Schmidtke, P. C., Cowley, A. P., & Udalski, A. 2014a, ATel, 6137 [Google Scholar]
- Schmidtke, P. C., Cowley, A. P., & Udalski, A. 2014b, ATel, 6135 [Google Scholar]
- Skinner, G. K. 1980, Nature, 288, 141 [NASA ADS] [CrossRef] [Google Scholar]
- Skinner, G. K., Shulman, S., Share, G., et al. 1980, ApJ, 240, 619 [NASA ADS] [CrossRef] [Google Scholar]
- Skinner, G. K., Bedford, D. K., Elsner, R. F., et al. 1982, Nature, 297, 568 [NASA ADS] [CrossRef] [Google Scholar]
- Smale, A. P., Charles, P. A., Densham, R. H., et al. 1984, MNRAS, 210, 855 [NASA ADS] [CrossRef] [Google Scholar]
- Stevens, I. R. 1988a, MNRAS, 232, 199 [NASA ADS] [CrossRef] [Google Scholar]
- Stevens, I. R. 1988b, Adv. Space Res., 8, 485 [NASA ADS] [CrossRef] [Google Scholar]
- Tosti, G., Bagaglia, M., Campeggi, C., et al. 2004, in Ground-based Instrumentation for Astronomy, eds. A. F. M. Moorwood, & M. Iye, Proc. SPIE, 5492, 689 [Google Scholar]
- van Paradijs, J. 1998, in NATO Advanced Science Institutes (ASI) Series C 515, eds. R. Buccheri, J. van Paradijs, & A. Alpar, 279 [Google Scholar]
- White, N. E., & Carpenter, G. F. 1978, MNRAS, 183, 11 [Google Scholar]
- Zacharias, N., Finch, C. T., Girard, T. M., et al. 2012, VizieR Online Data Catalog: I/322 [Google Scholar]
- Zerbi, F. M., Chincarini, G., Ghisellini, G., et al. 2004, in Ground-based Instrumentation for Astronomy, eds. A. F. M. Moorwood, & M. Iye, Proc. SPIE, 5492, 1590 [Google Scholar]
All Figures
|
Fig. 1 Light curves g, r, i, z, J, H, K of A0538−66 observed with REM from Tstart = 56 903.2 MJD (3 September 2014). Red points are the flares lasting one or two days that repeat almost regularly every ~16.6 d. Errors are indicated at the 68% confidence level. |
| In the text | |
|
Fig. 2 REM light curves of A0538−66 folded at the orbital period of Schmidtke et al. (2014b). Errors are indicated at the 68% confidence level. Second panel (from top) shows the detrended g light curve obtained by subtracting the 5th order polynomial fitted to the g light curve (excluding flares). Red points correspond to the flares of Fig. 1. |
| In the text | |
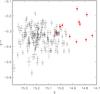 |
Fig. 3 Colour–magnitude diagram of A0538−66. Red points correspond to the flares of Fig. 1. |
| In the text | |
Current usage metrics show cumulative count of Article Views (full-text article views including HTML views, PDF and ePub downloads, according to the available data) and Abstracts Views on Vision4Press platform.
Data correspond to usage on the plateform after 2015. The current usage metrics is available 48-96 hours after online publication and is updated daily on week days.
Initial download of the metrics may take a while.