Free Access
Fig. 8
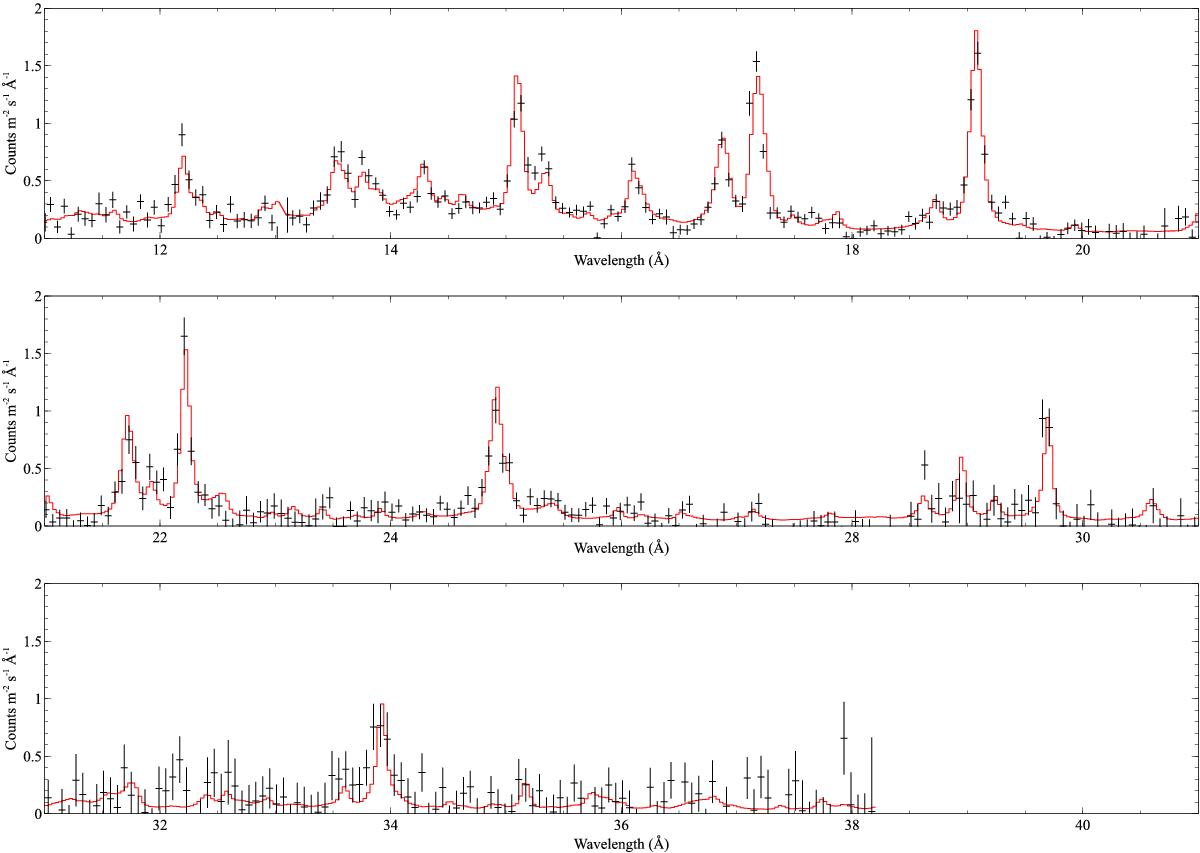
Our 2012–13 best-fit emission line model fitted to the 2004–07 stacked spectrum. Only the normalisations and broadening values of the emission line model were fitted to this spectrum. The data are shown in black and the total model in red. The data are binned by two for display purposes.
Current usage metrics show cumulative count of Article Views (full-text article views including HTML views, PDF and ePub downloads, according to the available data) and Abstracts Views on Vision4Press platform.
Data correspond to usage on the plateform after 2015. The current usage metrics is available 48-96 hours after online publication and is updated daily on week days.
Initial download of the metrics may take a while.