Fig. 6
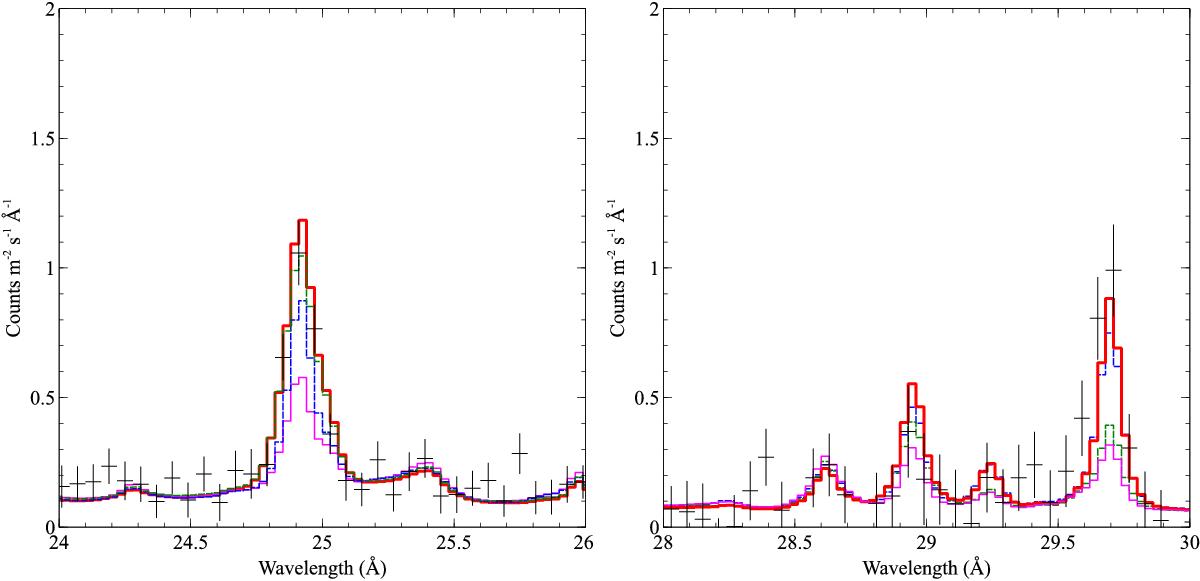
Fits with two collisional, three photoionised emission models. A five times over abundance of nitrogen model shown for intrinsic AGN gas only (dashed blue line), starburst emission lines only (dashed green line) and for both intrinsic AGN and starburst gas (thick red line), compared to the same model with solar abundances throughout (thin pink line). The data are binned by two for display purposes. For details see text and Table 3. Left: region around N VII 1s–2p and N VI 1s–3p. Right: region around N VI He-like triplet, including C VI 1s–3p.
Current usage metrics show cumulative count of Article Views (full-text article views including HTML views, PDF and ePub downloads, according to the available data) and Abstracts Views on Vision4Press platform.
Data correspond to usage on the plateform after 2015. The current usage metrics is available 48-96 hours after online publication and is updated daily on week days.
Initial download of the metrics may take a while.