Fig. 5
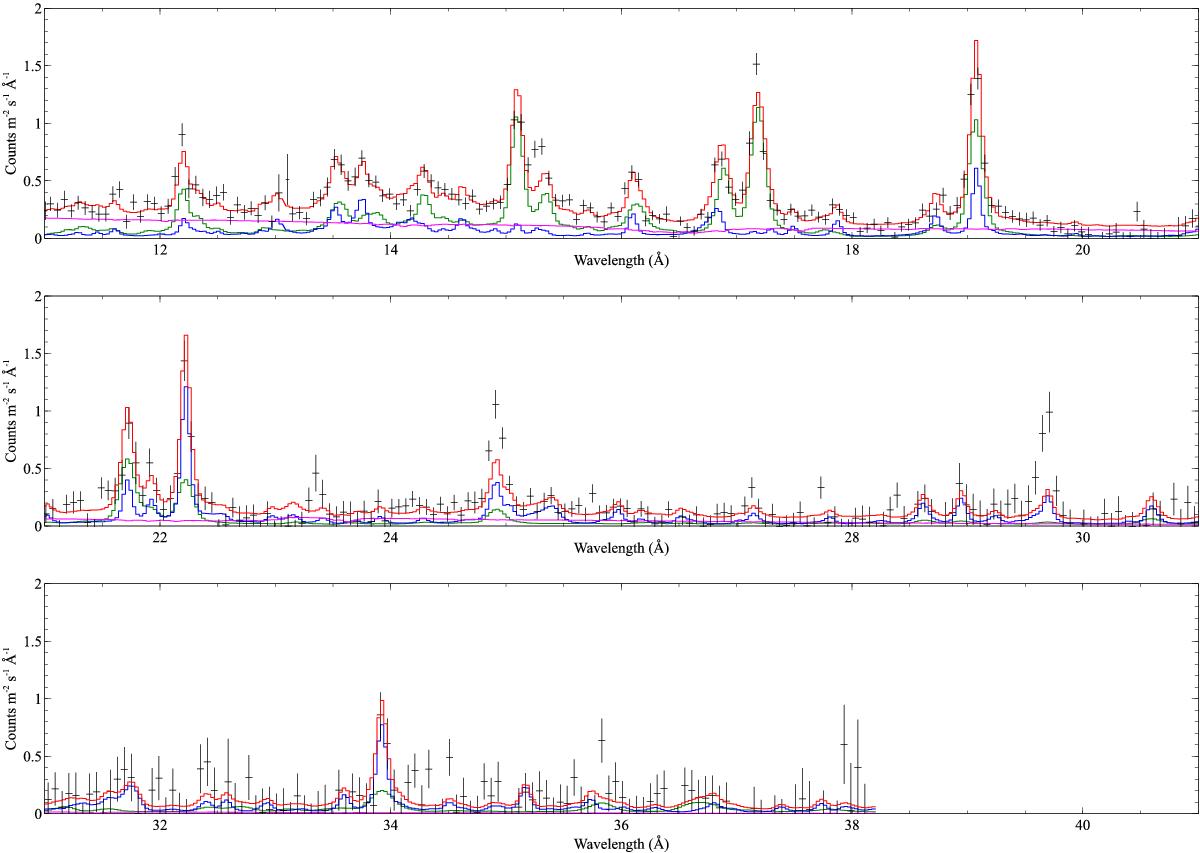
Stacked 2012–13 spectrum with best fit continuum and absorption model, two collisional emission models and three photoionised emission models, all using solar abundances. C-statistic = 1756. The data are shown in black, the total model in red and the absorbed powerlaw component in pink. The collisional emission components are combined and shown in green. The photoionised emission phases are combined and shown in blue. The data are binned by two for display purposes. For details see text.
Current usage metrics show cumulative count of Article Views (full-text article views including HTML views, PDF and ePub downloads, according to the available data) and Abstracts Views on Vision4Press platform.
Data correspond to usage on the plateform after 2015. The current usage metrics is available 48-96 hours after online publication and is updated daily on week days.
Initial download of the metrics may take a while.