Fig. 2
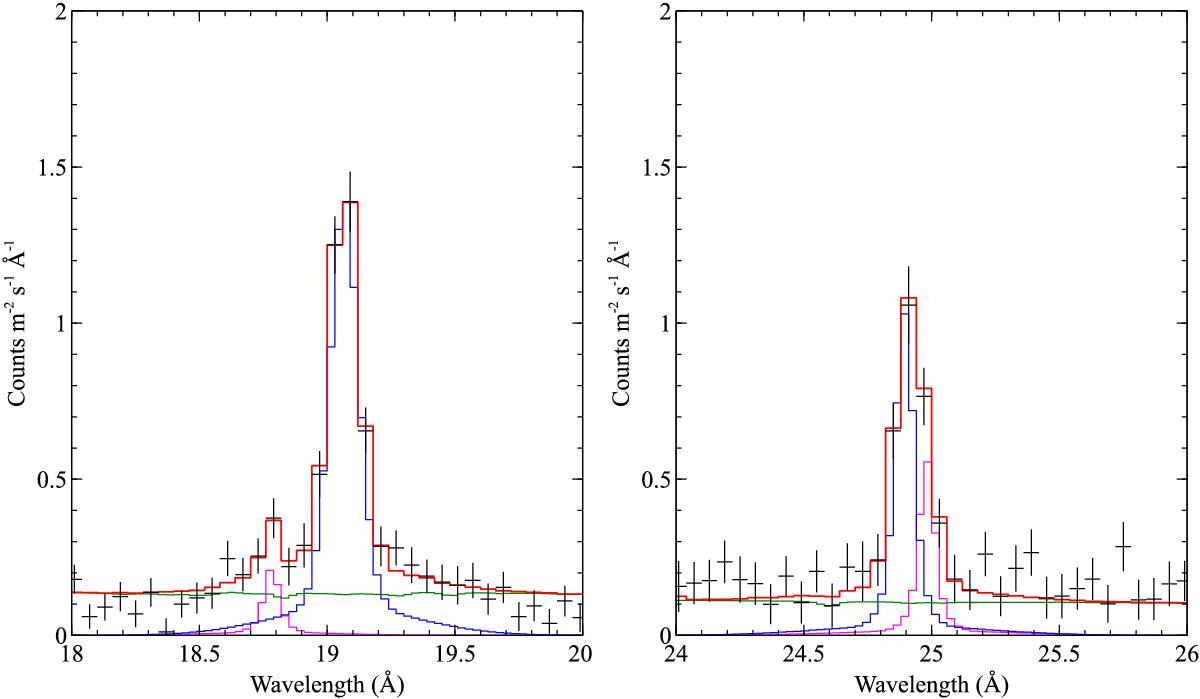
Location of the two new 1s–3p emission lines found, with Gaussian components shown. In both panels the data are shown in black, the total model in red and the absorbed powerlaw component in green. Left: Gaussian components for O VIII 1s–2p and O VII 1s–3p shown in blue and pink respectively. Right: Gaussian components for N VII 1s–2p and N VI 1s–3p shown in blue and pink respectively.
Current usage metrics show cumulative count of Article Views (full-text article views including HTML views, PDF and ePub downloads, according to the available data) and Abstracts Views on Vision4Press platform.
Data correspond to usage on the plateform after 2015. The current usage metrics is available 48-96 hours after online publication and is updated daily on week days.
Initial download of the metrics may take a while.