Fig. 1
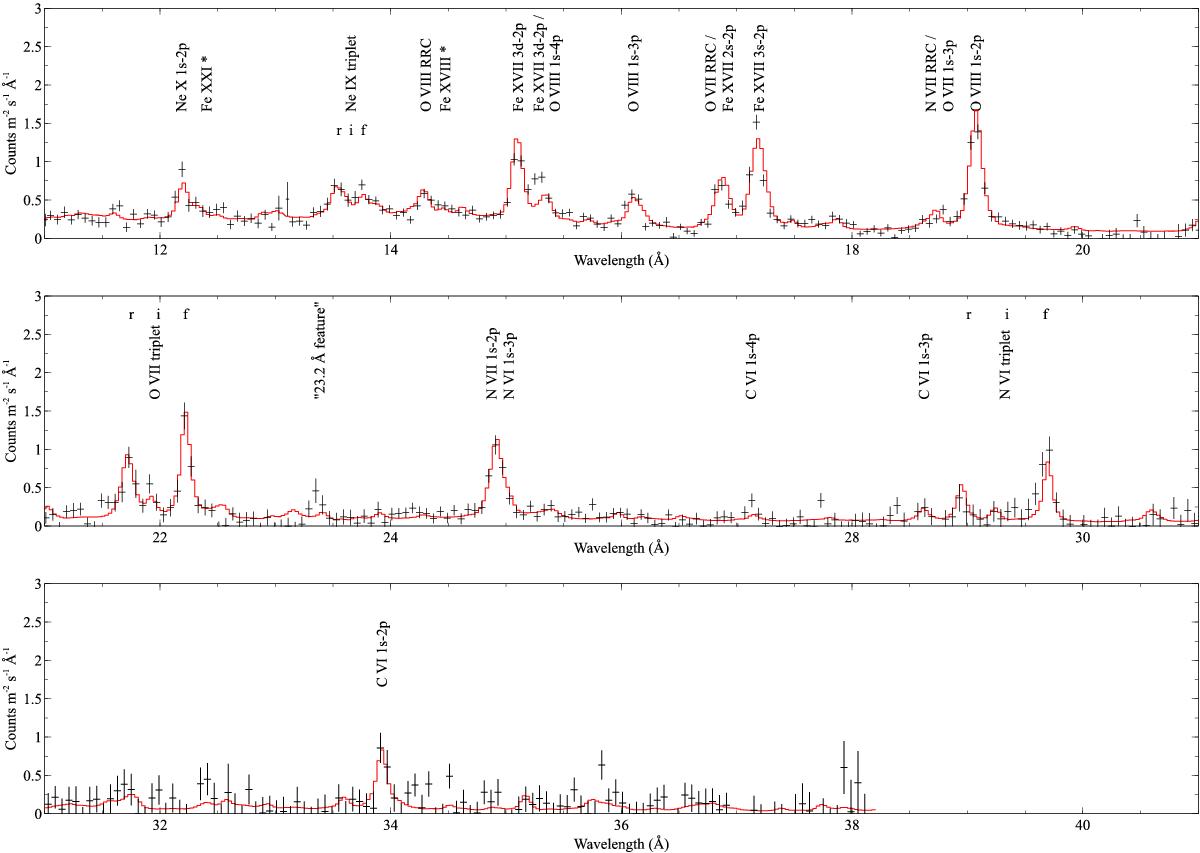
2012–13 RGS spectrum and line labels for detected emission lines. r, i and f represent the resonance, intercombination and forbidden lines of a He-like triplet, respectively. A * indicates uncertainty in the line identification. The data are binned by two for display purposes. The data are shown in black, and the model in red. For details of the model shown here, see Sect. 3.5.
Current usage metrics show cumulative count of Article Views (full-text article views including HTML views, PDF and ePub downloads, according to the available data) and Abstracts Views on Vision4Press platform.
Data correspond to usage on the plateform after 2015. The current usage metrics is available 48-96 hours after online publication and is updated daily on week days.
Initial download of the metrics may take a while.