Free Access
Fig. 9
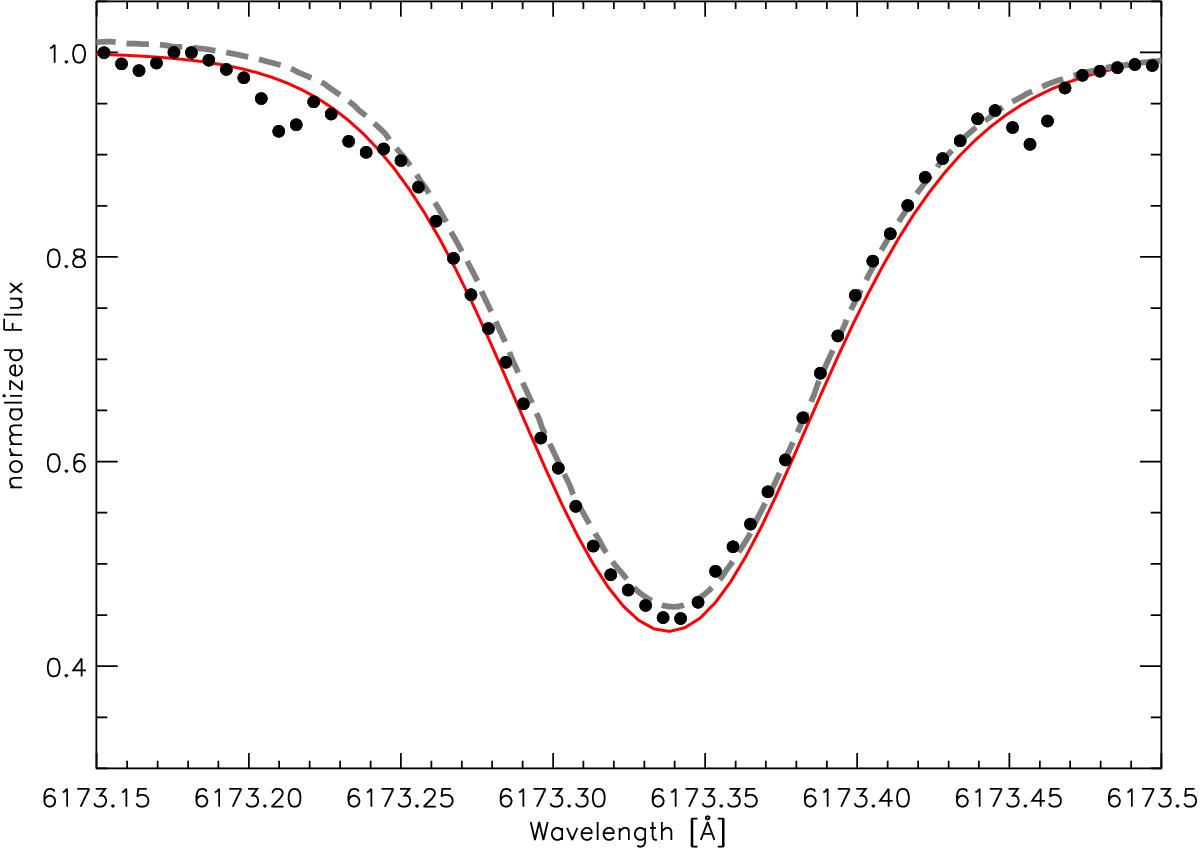
Comparison of unperturbed line profiles; black circles: observed solar spectrum outside transit; gray dashed line: solar atlas; red solid line: modeled line profile for the entire solar disk. Telluric lines appear at λ = 6173.2–6173.25 Å and 6173.45 Å in the observations but are averaged out in the solar atlas.
Current usage metrics show cumulative count of Article Views (full-text article views including HTML views, PDF and ePub downloads, according to the available data) and Abstracts Views on Vision4Press platform.
Data correspond to usage on the plateform after 2015. The current usage metrics is available 48-96 hours after online publication and is updated daily on week days.
Initial download of the metrics may take a while.