Free Access
Fig. 4
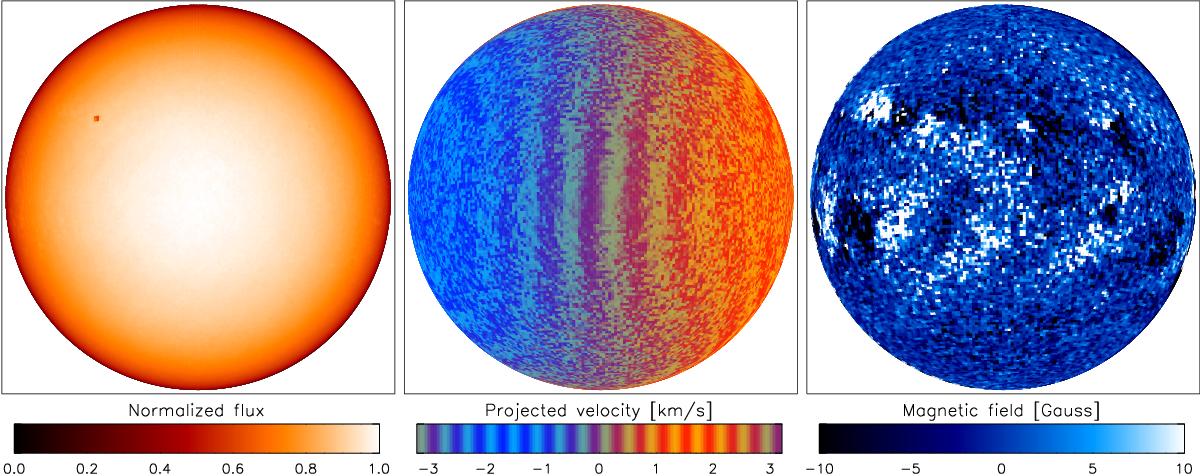
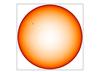
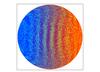
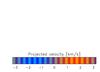
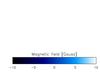
HMI images taken at 09:36 UT, exposure time 720 s, shown at the resolution of our simulations. Left: intensity showing empirical limb darkening and a small sunspot at NE; middle: Dopplergram shown with the same color code as in Fig. 3; right: magnetogram showing positive (white) and negative (black) magnetic polarities.
This figure is made of several images, please see below:

Current usage metrics show cumulative count of Article Views (full-text article views including HTML views, PDF and ePub downloads, according to the available data) and Abstracts Views on Vision4Press platform.
Data correspond to usage on the plateform after 2015. The current usage metrics is available 48-96 hours after online publication and is updated daily on week days.
Initial download of the metrics may take a while.