Fig. 1
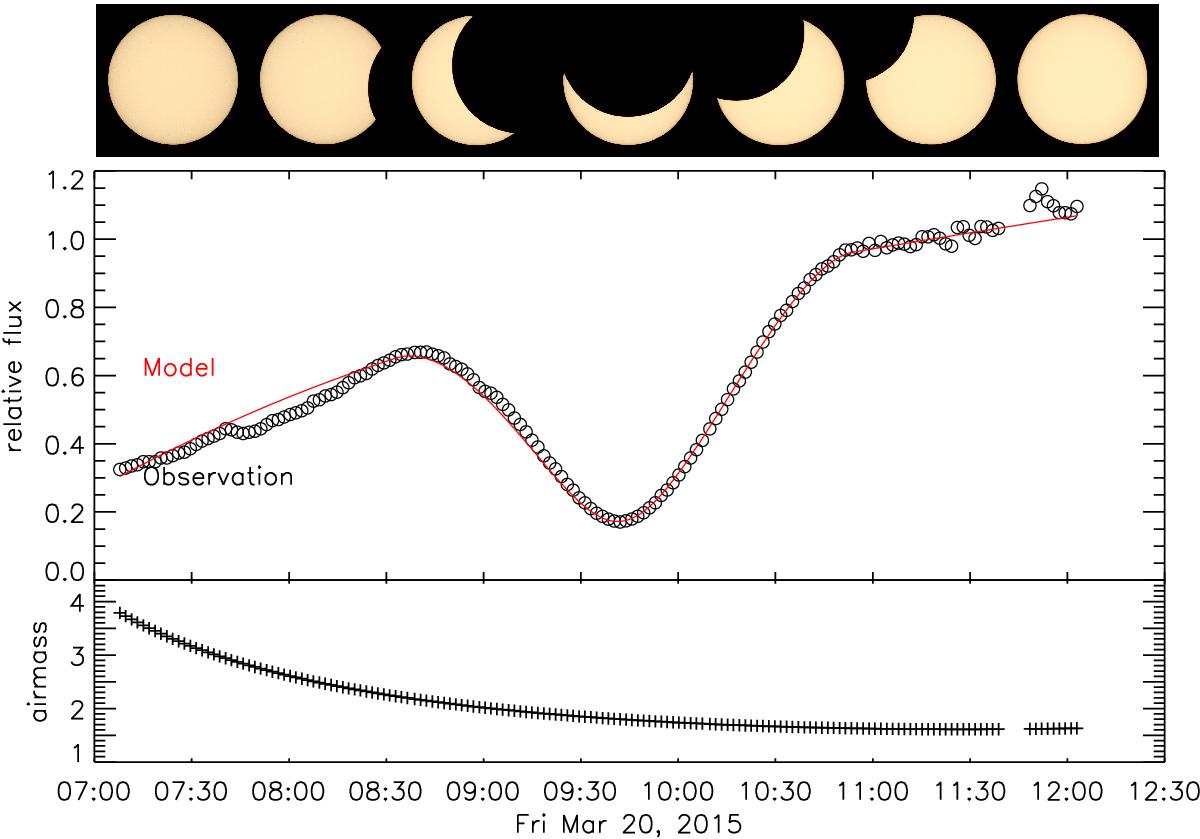
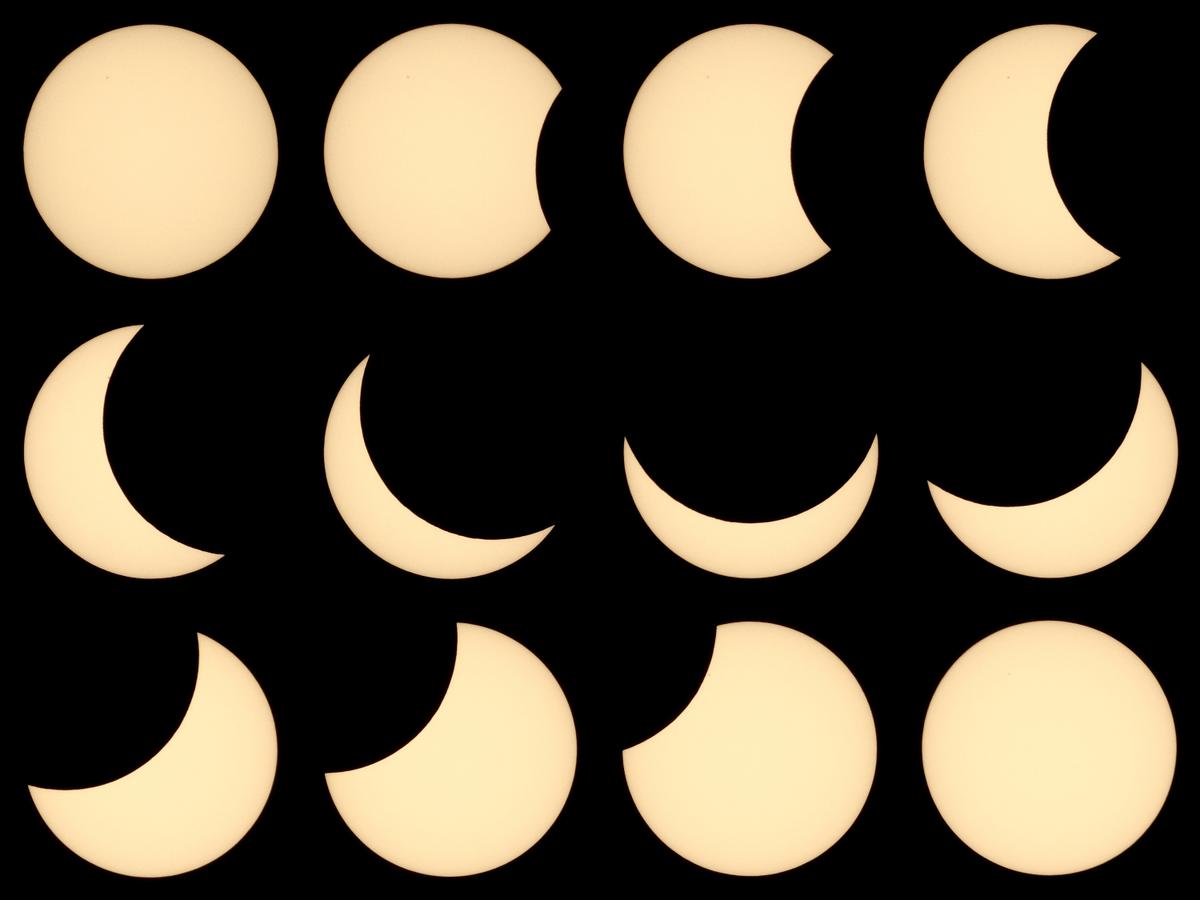
Upper panel: photographs of the solar eclipse taken at our observatory; middle panel: observed flux normalized to 1.0 at 11:00 UT, black open circles show flux integrated from our observed spectra, the red line shows the flux from our extinction model and eclipse (see text); bottom panel: airmass during our observations. Times are given in UT.


Current usage metrics show cumulative count of Article Views (full-text article views including HTML views, PDF and ePub downloads, according to the available data) and Abstracts Views on Vision4Press platform.
Data correspond to usage on the plateform after 2015. The current usage metrics is available 48-96 hours after online publication and is updated daily on week days.
Initial download of the metrics may take a while.