Fig. B.2
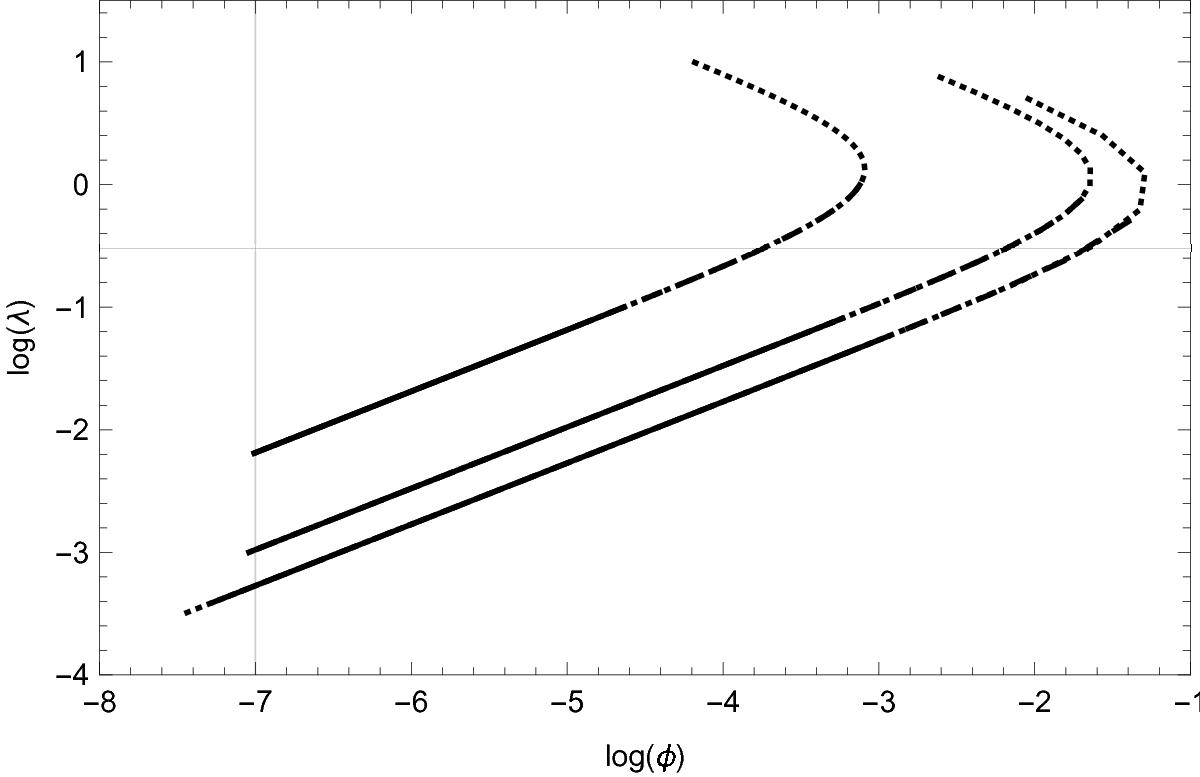
log (λ) versus log (φ). Factor f varies from f = 0.99 (left), f = 0.75 (center) to f = 0.5 (right). Each of these curves starts with three initial values of λ0, dotted line (λ0 = 10), dashed line (λ0 = 1) and solid line (λ0 = 0.1). See text for details. The vertical gray solid line shows the selected value of ϵ = 10-7 as a criterion to finish the iteration process. The horizontal gray solid line shows the value of λ = 0.2956 (log (λ) = −0.53) obtained using the L–Curve or GCV methods.
Current usage metrics show cumulative count of Article Views (full-text article views including HTML views, PDF and ePub downloads, according to the available data) and Abstracts Views on Vision4Press platform.
Data correspond to usage on the plateform after 2015. The current usage metrics is available 48-96 hours after online publication and is updated daily on week days.
Initial download of the metrics may take a while.